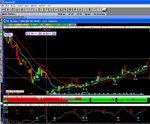
Best short term oscillator?

NickW

Junior member
Messages
47
Likes
0
Hi,

I trade the S&P emini's on 1 min charts.

I'm on the look out for an oscillator that gives fairly reliable divergence signals during tight choppy periods that may last from 1-2 hours. The objective is to give me a clue as to the direction of the likely break.

I'm currently looking at CCI - is there anything better?

Cheers, Nick
 
OK everyone What in your opinion is the best CCI number to use is it 14 100 150 ??? (just curious)
 
Depends on the charting package. On AIQ I used 90 on Sierra I use 150 and 42.......
 
CCI

ChartMan,
I have a personal interest and are sure others do too in the use of CCI on Sierra. Could you please elaborate a little on the use of "150 and 42" i.e. 1 min, 5 min charts etc. and the reasons for your choice.

Cheers
 
GREAT REPLY NEIL

Yes I for one check out the above link daily, I have had a whisper that the new EURO BABY is head hunting FTZ 40, if successful that would be a great bonus.
 
CCI.. 13 3 smoothe dversus cc1 13,7 smoothed..

>0 = long
3 smoothed >7 = buy
3<7 sell

and vice versa.. short..
 

Attachments

  • spoos1.jpg
    spoos1.jpg
    137.3 KB · Views: 1,034
Hi madasafish.

With the smoothing lines, I can't get them on Sierrachart. Is it the as a 3 period and 7 period MA?
 
Hi
As you know the CCI is sensitive to the acceleration and deceleration of price moving away from its MA. The CCI will move to extreme readings as the distance between the current price and its average becomes larger compared to the recent average of this deviation.

Dividing the current price deviation by the mean deviation makes CCI sensitive to market volatility. As the mean deviation increases, the CCI will become less sensitive to price movement. Conversely, the CCI will be more sensitive during a quiet/stable market. I am not sure if it can be really usefull in tight choppy period.
Is there anyone who can correct me if I am wrong please?!
 
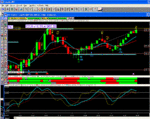
well I also use a 6,2 and 6,7 CCI for short term trading.. and the calls are very good

I only use a 3 minute chart due to the false signals in 2 mins.. but looking at today's S&P at 4.45 today: I enclose my chart showing the buy/sell signals..

PS: no signal is taken until the bar closes,, so the sell signal at 850 my be premature.
 
For the best advice on setups and how to get the best signals I would advise you to visit Paltalk (Woodies CCI room) I have to say its the best room I know of for trading the ES using CCI. There are between 300-500 people in the room but be quick cos they are setting up another room as paltalk only allows 200 max so they have to operate 2 rooms.
 
As a newbie to CCI, Could someone please explain if this indicator is any use at all, for a simple set-up of MA(100) on a 1 minute chart. My chart is DJIA on prophetsfinance, and am using chartmans or is it Mr.Charts theory of entering in direction of market when price is at least 20/30 points away from MA(100).
If it is, what figures for the CCI should be entered, as I am becoming increasingly confused. ie. for each CCI, there are two boxes for options to enter figures, do I use both boxes to enter figures?
Also, are these supposed to be superimposed.
Many thanks,Kevin
 
try reading this first:
all CCI setups are slightly different and we all use it in different fashions..
http://www.linnsoft.com/tour/techind/cci.htm

I use the difference between the same period but smoothed in different time spans to identify changes up or down. It is very accurate and rarely fails to work.

The basic formula is
CCI(short term smoothed) - CCI(long term smoothed)

If >0 and the previous was -ve then CCI is rising and so will the price.. ie a direction change..

And vice versa.

When day trading futures with short trends and 3-6 Spoos points per move getting in at the start and out at the end is important.
 
Top