Today is Monday December 27th and the US is open. Many would say, "oh, what's the point, the action will be thin and the pickings, if any, hard." Well, in my experience, that approach is mistaken. 36 minutes before the market even opened today, I read this story:
"Amazon.com, Inc. (AMZN) said Monday the 2004 Holiday season was its "best ever", with the online retailer setting a record of more than 2.8 million units ordered in a single-day, or 32 items per second worldwide. The Seattle-based company said consumer electronics sales was its largest sales category."
Again many would say, "oh, the news will be in the price so it's pointless" This is also just plain wrong a lot of the time.
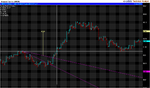
I have traded AMZN three times today, all profitably. On the second trade I did a screen shot of the entry and the exit.

As you can see, price had formed a tight consolidation - the bulls and the bears were apparently equal. Actually, they weren't - the bulls were about to take over.
How did I know that was a very high probability?- because I know from experience that this particular breakout pattern, with a minimal pullback from highs, works most of the time provided that the bearish pressure was disappearing and bullish pressure mounting.
My exact entries and exits are strongly influenced by my reading of the "tape" - this is an integrated method of chart patterns, level 2, time and sales and the way I specifically interpret the evidence these reveal of trader sentiment at the time. Tape reading is a huge subject and beyond the purposes of this article. If there is interest I will try to return to the subject in a future piece but for present purposes suffice to say it essentially involves seeing the buy and sell pressures waxing and waning, the trades actually being printed, the behaviour of major market participants such as leading market makers and ECNs and how all these come together at different price levels.
I use many patterns, all are tried and tested and have been back tested and forward walked live - only then am I confident enough to trade them for real. If the set up pattern is present I will only take the trade if it is confirmed by my tape reading. For example, with breakouts this approach actually keeps me out of several trades which then fail.
In the case of the AMZN trade, after identifying the pattern and reviewing the tape I entered at 40.93 before the break out above the high of 43.00. What was the risk? Negligible. Had the tape suddenly and immediately turned against me, which from experience of this type of trading is possible but very unlikely, I would have been out for, at very worst, a tiny loss of three to five cents. If it had broken out to a new high and quickly failed I would have been out before it had fallen back to the entry at 40.93 for a tiny profit.
This approach means that on the rare occasions the break out fails, and tape reading hasn't kept me out of the trade, then it's unusual for me to make a loss. So knowing what the worst case scenario was I felt very comfortable and quietly confident, but if proved wrong by the market, ready to simply exit the trade immediately and without hesitation.
What was the risk/reward? Three to five cents risk against a completely unknown reward. How could I possibly know where this was going? It would have just been a guess - useless.
What would the percetage probability of failure against success have been? That's different - I know from experience this pattern works most of the time when confirmed by tape reading. I don't actually have to guess where it's going or how far - I'm on board for profit with absolutely minimum risk - and that's good enough for me - and a lot better than any classical technical analysis derived target.

This is the point of exit seven minutes later at 41.36 for a 43c profit. On 1000 shares that is $430; 2000 shares $860; 3000 shares $1290 and so on. With a stock like AMZN there is no problem taking a few thousand shares when you want.
As you can see by comparing the two charts once I entered the trade it did not move against me at all. Why exit where I did? The price had run up quite sharply in those few minutes and it was time for a pause or sudden retracement - that put me on alert - that is, it set up a potential exit IF my tape reading confirmed a potential fall. Buying pressure decreased and selling pressure increased, so I exited and banked the profits.
Does it matter whether the stock then headed north again? No, because I had taken my profits and could always re-enter if another high probability trade set up. I'm then ready to look for another opportunity in this stock or another, maybe using another pattern, maybe the same one.
"Amazon.com, Inc. (AMZN) said Monday the 2004 Holiday season was its "best ever", with the online retailer setting a record of more than 2.8 million units ordered in a single-day, or 32 items per second worldwide. The Seattle-based company said consumer electronics sales was its largest sales category."
Again many would say, "oh, the news will be in the price so it's pointless" This is also just plain wrong a lot of the time.
I have traded AMZN three times today, all profitably. On the second trade I did a screen shot of the entry and the exit.
As you can see, price had formed a tight consolidation - the bulls and the bears were apparently equal. Actually, they weren't - the bulls were about to take over.
How did I know that was a very high probability?- because I know from experience that this particular breakout pattern, with a minimal pullback from highs, works most of the time provided that the bearish pressure was disappearing and bullish pressure mounting.
My exact entries and exits are strongly influenced by my reading of the "tape" - this is an integrated method of chart patterns, level 2, time and sales and the way I specifically interpret the evidence these reveal of trader sentiment at the time. Tape reading is a huge subject and beyond the purposes of this article. If there is interest I will try to return to the subject in a future piece but for present purposes suffice to say it essentially involves seeing the buy and sell pressures waxing and waning, the trades actually being printed, the behaviour of major market participants such as leading market makers and ECNs and how all these come together at different price levels.
I use many patterns, all are tried and tested and have been back tested and forward walked live - only then am I confident enough to trade them for real. If the set up pattern is present I will only take the trade if it is confirmed by my tape reading. For example, with breakouts this approach actually keeps me out of several trades which then fail.
In the case of the AMZN trade, after identifying the pattern and reviewing the tape I entered at 40.93 before the break out above the high of 43.00. What was the risk? Negligible. Had the tape suddenly and immediately turned against me, which from experience of this type of trading is possible but very unlikely, I would have been out for, at very worst, a tiny loss of three to five cents. If it had broken out to a new high and quickly failed I would have been out before it had fallen back to the entry at 40.93 for a tiny profit.
This approach means that on the rare occasions the break out fails, and tape reading hasn't kept me out of the trade, then it's unusual for me to make a loss. So knowing what the worst case scenario was I felt very comfortable and quietly confident, but if proved wrong by the market, ready to simply exit the trade immediately and without hesitation.
What was the risk/reward? Three to five cents risk against a completely unknown reward. How could I possibly know where this was going? It would have just been a guess - useless.
What would the percetage probability of failure against success have been? That's different - I know from experience this pattern works most of the time when confirmed by tape reading. I don't actually have to guess where it's going or how far - I'm on board for profit with absolutely minimum risk - and that's good enough for me - and a lot better than any classical technical analysis derived target.
This is the point of exit seven minutes later at 41.36 for a 43c profit. On 1000 shares that is $430; 2000 shares $860; 3000 shares $1290 and so on. With a stock like AMZN there is no problem taking a few thousand shares when you want.
As you can see by comparing the two charts once I entered the trade it did not move against me at all. Why exit where I did? The price had run up quite sharply in those few minutes and it was time for a pause or sudden retracement - that put me on alert - that is, it set up a potential exit IF my tape reading confirmed a potential fall. Buying pressure decreased and selling pressure increased, so I exited and banked the profits.
Does it matter whether the stock then headed north again? No, because I had taken my profits and could always re-enter if another high probability trade set up. I'm then ready to look for another opportunity in this stock or another, maybe using another pattern, maybe the same one.
Last edited by a moderator: