A Professional Approach to Trading Futures

Hello Traders

Sadly we have learned of military conflict between Israel, USA and Iran that has started
a few hours ago. We have experience with this unfortunate circumstance and offer the
following comment
-----------------------------------------

What to Expect During the Coming Days

Immediate Effect on S&P 500 Futures
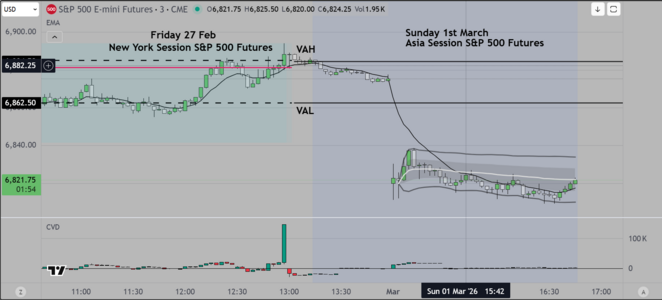
  • Sunday Evening Opening: Futures are likely to experience a "gap down" as markets first react to the news of strikes on Tehran and the subsequent Iranian retaliatory missile launches.
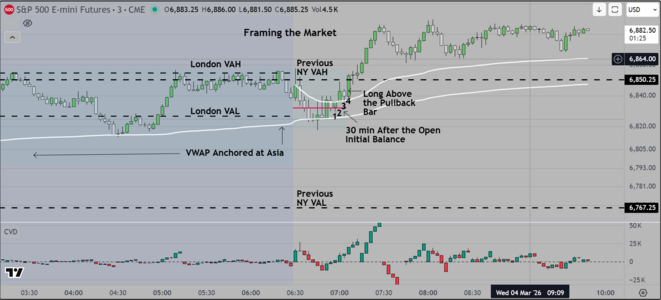
  • Monday New York Session: The session is expected to be characterized by heightened volatility (VIX spike). If the conflict shows signs of expansion or prolonged disruption to energy corridors, the sell-off may intensify.
  • Historical Context: In previous escalations between these entities, such as in June 2025, S&P 500 futures dropped approximately 0.4% immediately upon the news. Given the "major combat operations" status declared by President Trump, the reaction in 2026 may be more severe
It is likely that we will take the following precautions prior to both the London and New York Sessions of the S&P 500 Futures

We will monitor world news and also list the high impact economic reports that may affect the markets
Based on price action during the Initial Balance (in the first hour) we may simply stand aside for that entire session
so that we can evaluate the data. In that case we would trade as early as Tuesday

Scenarios

1) Institutions will back off and liquidity may dry up for a period of time as markets move lower or
2) Markets may exhibit trading range behavior until more visibility is obtained as to world events
3) If institutions choose a "Risk Off" posture, we expect an extended move as much as 4% lower
4) If this conflict is brief (a matter of days), then institutions will look to buy back inventory at or near
Monday/Tuesday lows. Based on news to this hour, we expect a duration of 2-7 days.

Good Luck
 
After watching World News, and reviewing new data, we have the following
additional comments.

Please note that this is not to be construed as Investment advice, it is simply our
opinion and we suggest readers consult with their own qualified advisors before
making investment decisions
------------------------

During the next Sessions of several markets we will build small positions in the following
assets

  • Flight to Quality: Expect heavy institutional flows into traditional safe havens: Gold, the Japanese Yen, the Swiss Franc, and U.S. Treasuries. Gold, in particular, is seen as a key winner during this rising tension.
  • Energy Sector Dominance: The energy sector is the "obvious" rally candidate for Monday. Oil prices are expected to spike due to Iran's 3% global supply share and potential threats to the Strait of Hormuz. Analysts suggest a 10–25% premium on oil is likely, even without a full blockade; a complete closure of the Strait could lead to a 50% premium risk event.
-----------------------

As mentioned previously, we will probably stand aside from the S&P 500 (monitoring only)
however it makes sense (to us) to take these actions instead of trading the S&P Market.

Good luck
 
And here is our plan for the next few days

Tuesday, March 3: The "Wait and See" Consolidation

Historically, geopolitical shocks lead to an initial sharp reaction that often fades if the conflict does not immediately spiral further. Institutional desks will look for signs of stabilization or further escalation.
  • Assessing Escalation: If Iran continues to target civilian infrastructure or American bases in Bahrain, Qatar, UAE, Kuwait, Jordan, and Saudi Arabia, institutions will likely maintain high cash positions.
  • Technical Support Levels: Traders will be watching key technical levels closely. For instance, in global markets, the Nifty 50 at 25,000 is a monitored psychological mark; similar "make-or-break" technical levels will be identified for the S&P 500 to prevent additional technical selling.
  • Defensive Rotation: Institutional flows may rotate into defensive sectors such as FMCG (Consumer Staples) and Pharmaceuticals, which typically show relative stability compared to rate-sensitive or cyclical stocks during conflict.
Wednesday, March 4: Fundamental Re-Focus

By mid-week, institutional attention often begins to pivot back to broader economic fundamentals, provided the immediate military "fog of war" clears.
  • Earnings and Macro Data: While the conflict is a grave threat, it does not stop the next earnings cycle. Institutions will evaluate if the "Earnings Strength" of the S&P 500—which had been outpacing the rest of the world—remains intact.
  • Inflation and the Fed: A sustained spike in oil (e.g., a 50% increase) could stoke recession fears and alter expectations for Federal Reserve policy. Prior to the strikes, markets were pricing in a rate cut for June 17, 2026; desks will now be recalculating if energy-driven inflation delays this easing.
  • Position Sizing over Selection: Experienced desks will prioritize position sizing over individual security selection. Given the "high-wire act" of 2026, institutions will likely trim exposure to firms with direct geographical exposure to the conflict zone while maintaining core S&P 500 positions if the broader economy remains resilient.
Critical Technical Support Levels

While watching the S&P 500 on Monday, we will be monitoring these levels closely. What we suggest for the less experienced
traders, is to simply make note of the places where you would (usually) take a position, and document the result. It's' good education
and cost you nothing except your time.
  • Primary Support Zone: 6,830 – 6,842
    This area represents the most recent floor, with the February 27 session low at 6,841.50. A sustained break below this level on high volume would signal a shift in market structure from a "buy-the-dip" regime to a deeper correction.
  • Secondary Support: 6,730 – 6,752
    If the 6,800 psychological level fails, the next institutional target is 6,752 (a key February breakout point) and 6,730, which marks a critical structural "lower low" threshold.
  • Major Structural Support: 6,542
    In an extreme escalation scenario, the 200-day moving average and significant horizontal support at 6,542 come into play as the final line of defense for the 2026 bull trend
Good Luck
 
Hello Traders

Here on the West Coast USA, it is almost 5pm and the Asia Session has been in progress
for a while. As we outlined in our previous post(s), a re-pricing of risk is in progress. The gap
down we talked about is developing

We will continue to follow our plan
 

Attachments

  • Repricing of Rick Premium.PNG
    Repricing of Rick Premium.PNG
    104.7 KB · Views: 14
Hello Traders

The following High Impact Economic Reports are scheduled for release tomorrow
prior to and during the New York Session of the S&P 500 Futures. Time are ET (USA)

----------------
My "Read" of the markets and the impact of pending economic news is as follows
  • ADP Private Employment (08:15 ET):
    • Consensus: +48K.
    • Context: This follows a weak +22K in January. A significant miss here will be viewed as a harbinger of a "hard landing" for Friday's Non-Farm Payrolls, likely triggering a defensive flight to quality before the open. Broader market should move lower, Futures should "go with"
  • ISM Services PMI (10:00 ET):
    • Consensus: 53.5.
    • Context: The previous reading was 53.8. Given that the services sector represents ~90% of the US economy, any dip toward 50.0 will be seen as a major recessionary signal. Same interpretation as the previous, however at some point institutions will start to bargain hunt, looking
    • to buy at a discount and sell higher on Friday
------------------
Like my colleagues, I trade by time segment. Here is my basic game plan for tomorrow
The Open (09:30 – 10:00 ET)
  • Context: Markets are coming off a session where the Dow recovered nearly 800 points from its lows. Institutions will be looking at the Overnight (GLOBEX) High/Low and the 8:15 AM ADP reaction to determine the opening bias.
  • Strategy: If ADP misses (+30K or lower), expect a "Gap and Go" lower at the open as funds hedge against Friday's NFP. If ADP beats (+60K+), expect a test of the 6,800–6,830 resistance zone (based on March 3rd's open/high).

Initial Balance (10:00 – 10:30 ET)
  • The Catalyst: The 10:00 AM ISM Services PMI is the "main event."
  • Strategy: Institutional algos will trade the 10:00 AM candle with extreme prejudice.
    • ISM > 54.0: Pros will likely buy the dip, looking for a rotation back toward the 6,888 settlement price.
    • ISM < 52.0: This is a "sell-side" trigger. The Initial Balance (IB) high will likely be set in the first 5 minutes, and institutions will look to short any retracement to the IB Midpoint, targeting the March 3rd low near 6,718.

Euro/US Overlap & London Close (10:30 – 11:30 ET)
  • Context: This is when liquidity is highest. Large block orders and US institutions will dominate (London & Euro traders desks are most running automated programs and so are susceptible to being activated by sudden moves (short squeezes and stop hunts).
  • Strategy: At 11:30 AM (London Close), institutions often execute "MOC" (Market on Close) orders for European benchmarks, which can cause "fake-out" moves in ES futures. We will look for Value Area extensions. If price is holding above the Value Area High (VAH) during this window, we anticipate a trend day up; if pinned below Value Area Low (VAL), we expect a trend day down.

The Last Hour (15:00 – 16:00 ET)
  • Context: This is the "settlement run." After the volatility of the past 24 hours, the last hour will be about position squaring.
  • Strategy: With the ES recently trading near 6,785 (down 1.49%), the last hour will likely see "rebalancing" trades. If we are trading near the day's highs, expect a "profit-taking" sell-off at 3:30 PM. Conversely, if we are near the lows, watch for the "Short Squeeze" as intraday bears cover before the 4:00 PM cash close to avoid overnight geopolitical risk.
Good Luck
 
Hello Traders

Interestingly although some of you have engaged, no one has asked any questions
about this process

We attach a chart showing how we (and many other professionals) frame the S&P 500 Futures Market.
The reason this works is that by convention, most commercial and institutional participants are trained
similarly. A good basis for can be found in the work of James Dalton. Wouldn't hurt to buy one of his
books to verify. The work of Brian Shannon is also excellent and has validity

The Chart shows how we place Anchored VWAP and VP tools to create points of reference (one of them is "Value")
Price either "Accepts" or "Rejects" previous Value, and the institutions that control the markets make decisions
to buy or sell based on these "Key Reference Areas".

I will go a little way further down this road, but to be honest, it is getting rather boring (for me) so in the next week
I will stop and ask the moderators to remove the thread (if they wish).

Good Luck
 

Attachments

  • Framing the Market Mar 4.PNG
    Framing the Market Mar 4.PNG
    114.5 KB · Views: 2
Back
Top