A Professional Approach to Trading Futures

What an interesting Holiday Session

As mentioned previously I am monitoring only and that is a good thing
because here in "Sunny" California USA, it is stormy, windy and several power
outages this morning. My appliances and computer system are running on
an emergency generator powered by natural gas. My Internet has been in
and out and I am using my Iphone "hotspot" as my Internet connection now.
Wonderful

The day is going about as expected, low volume, not much early follow through
but enough that adventurous traders have reason to be happy

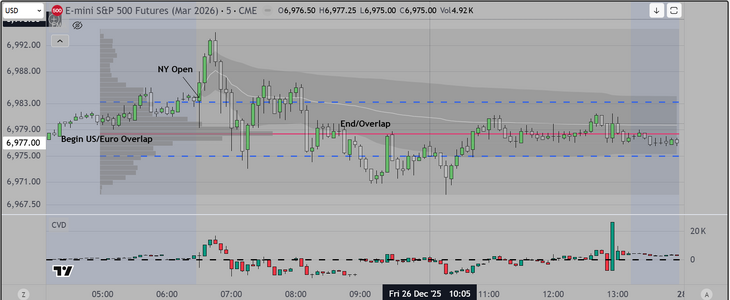
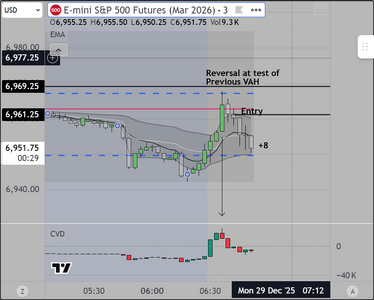
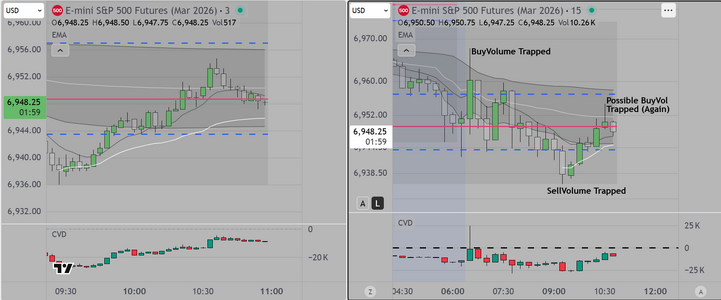
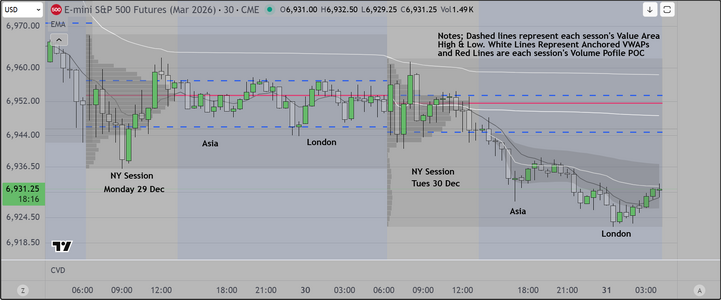
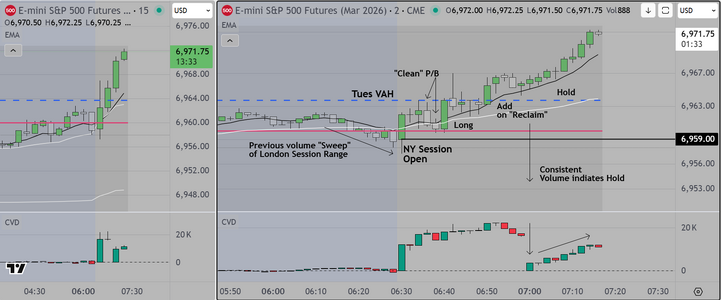
Posting a chart that shows the following (just the broad outlines)

1) during London, typical "drift" higher, and then in the last auction, the market
"Sweeps" the range to the downside. This tells experienced traders that there will
likely be a reversal at the open
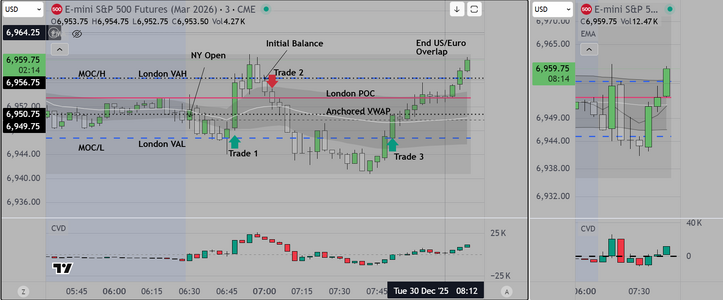
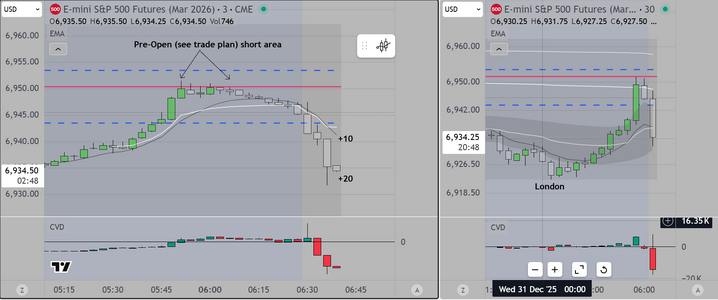
2) At the open the anticipated reversal happens and for those of us with the requisite
experience (and the ability to execute), it is simply a matter of assessing whether you
want to take risk on a day like this. (I would not)
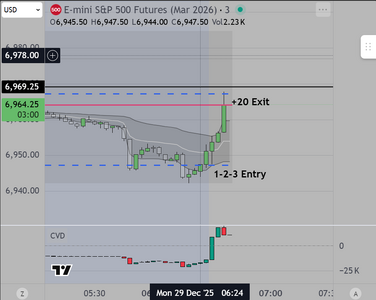
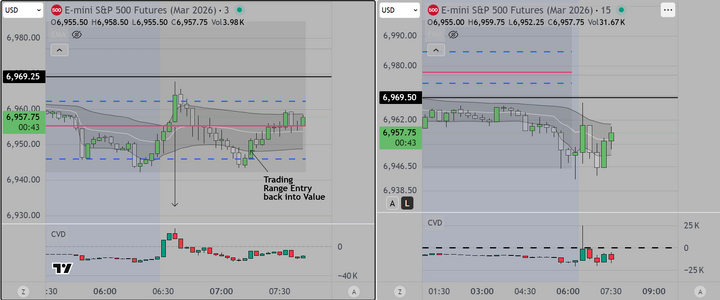
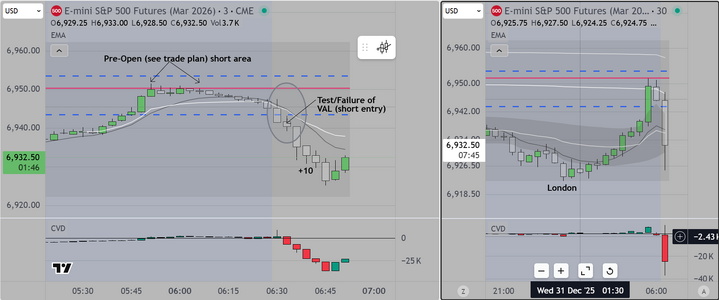
3) For those who DO want to accept risk, you wait for the first "Clean" pullback (clean p/b on
my chart) to test one or more key references, you look at volume and you ask yourself
"do I feel lucky" (a Clint Eastwood reference). IF you do (feel lucky) long entry and monitor
volume.
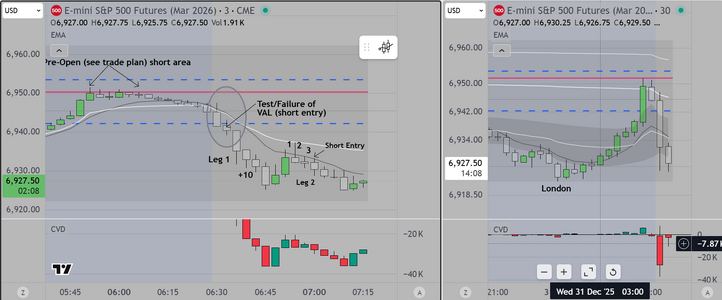
4) The rest of the session is about recognizing repetitive behavior (that is an important part
of what I teach) and you hold as long as volume continues in your direction.

Good luck

Postscript

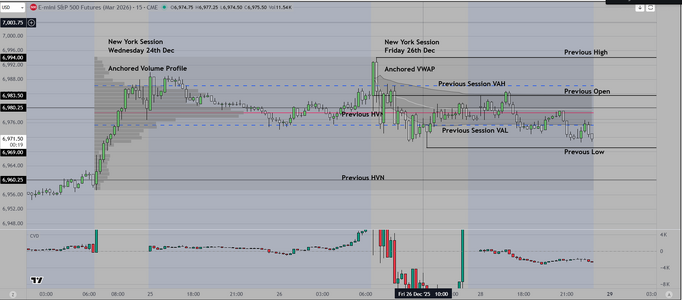
Observant folks may notice the text "Add on Reclaim". Look carefully. Price breaks above
the previous VAH (Value Area High), then retests. Volume comes in and price takes off to
the upside. This is a "reclaim" and institutional algos are triggered by this behavior. It is
a high probability long entry and it also means that there is likely going to be at least
some follow through (which was not expected in this shortened session). This has to be
a nice surprise for professionals.
 

Attachments

  • Dec 24 2025.PNG
    Dec 24 2025.PNG
    131.1 KB · Views: 45
Last edited:
For Interested persons, this is the final version of a system built especially for
struggling traders. I believe it to be as "simple" as possible, while still providing
the critical data necessary for success.

From this point forward, when I transition to LiveStreaming via Zoom I will be
presenting an entirely "institutional" viewpoint, and with that a 1) different way of looking
at market structure (known as "Regimes") 2) different terminology, and a 3) different way
of identifying opportunity based on the Time Based influence of Economic News.

Attaching a chart that illustrates a few of those differences, and also for those who are interested
in making this their profession, I recommend books by James Dalton including "Mind over Markets"
"Markets in Profile", and "Markets & Momentum".

Good luck
 

Attachments

  • Dec 26.PNG
    Dec 26.PNG
    99.2 KB · Views: 25
Last edited:
Hello London & Euro Traders
Current time in The City is 2:43am

We are posting this composite chart, showing the locations of our Anchored VWAP
and Volume Profiles. We use this preliminary data to prepare to resume trading the
New York Session of the S&P 500 Futures on Monday 29th Dec

Observant readers may notice that we have extended lines from the HVN (high volume nodes)
If you follow those lines until they meet price, you will notice that at these intersections price starts
to trend. We would be looking for possible entries in the same direction upon retest. We would consider
these relatively high probability entries.

A secondary consideration is economic news, and although the data will be light, there will be a few items
whose impact may produce a negative response. We will return to comment on that later.

Good luck
 

Attachments

  • Prev Week Composite.PNG
    Prev Week Composite.PNG
    99.1 KB · Views: 24
As with many such efforts, my attempts to LiveStream met with challenges. So I will
start by using Zoom meetings, and issue invitations on a "first come first served" basis
to watch my trading during the NY Session of the S&P 500 Futures which will start at
2:30pm London Time. Interested persons should make themselves known in time for
the open. I will provide a limited number of credentials to enter the Zoom Meeting.

Attaching the Markup that I begin with as well as a summary of the high impact economic
reports scheduled for release as follows

The release times for the high-impact reports in London time are:
  • Pending Home Sales (November 2025): 3:00 PM GMT
  • Dallas Fed Manufacturing Index (December 2025): 3:30 PM GMT
  • If both reports come in near their consensus estimates (around +1.0% for home sales and similar levels for Dallas Fed activity), the S&P 500 futures are likely to see minimal movement or continue their current positive drift, as the information is already priced into the market.
  • If the reports beat consensus (stronger economy):
    • Stronger than expected housing data or a significant improvement in the Dallas Fed Index could initially boost the S&P 500 futures, as it signals a resilient economy.
    • However, persistently strong economic data (amidst current high valuations and above-target inflation) raises concerns that the Federal Reserve might maintain higher interest rates for longer, which could eventually put downward pressure on stock futures.
  • If the reports miss consensus (weaker economy):
    • Weaker than expected data, such as a decline in pending home sales or a deeper contraction in manufacturing, might initially cause the S&P 500 futures to dip, signaling potential economic weakness.
    • This could lead some investors to expect more aggressive interest rate cuts from the Fed in the future, which might lead to a rebound later in the session, particularly in rate-sensitive sectors.
 

Attachments

  • Dec 28 Markup.PNG
    Dec 28 Markup.PNG
    100.8 KB · Views: 15
Last edited:
Good Afternoon London & Euro Traders

Off to a good start as we collected +20 on the spike open inside Value
We had just over 900 inquiries and were able to provide all allowed invitations
Next session we will adjust to the next level of Zoom to allow more attendees

Additional Note

We did accept more risk than usual at this open, because the market opened inside
value. Normally we would not be entering in the pre-market on a 1-2-3 setup
Also readers of my thread may notice that the position of the VWAP relative to POC
(VWAP below POC suggested skew to the upside, as price moved past the VWAP
the entry was triggered)

Good luck
 

Attachments

  • First Trade.PNG
    First Trade.PNG
    59.1 KB · Views: 15
And Trade 2

Which was a reversal at a test of the Previous VAH (Value Area High)
I noticed a lot of copy traders in this crowd and warned folks 1) not to copy me
without understanding the risks, and 2) without understanding my system first
Sad. Luckily both trades worked out ( this time).

We will take a risk averse posture until the next time based opportunity which will
be at the end of the US/Euro Overlap.

Our final time based opportunity will be the "Power Hour"

We will offer a few comments on the system however we will not disclose the
system (we reserve that for the class)

Good luck
 

Attachments

  • 2bd traade.PNG
    2bd traade.PNG
    70.4 KB · Views: 19
While we wait for the next time based entry we will post our "read"
of this developing setup, (failure at the VAH and reversal) as follows
----------------------

What the divergence is signaling​


At the previous value area high, two important things occur:

  1. Price trades above the prior range high / VAH
  2. CVD spikes positively, then rolls over
  3. Price fails to continue higher despite aggressive buying

This combination tells a clear tape story:

  • Aggressive buyers lifted the offer (CVD rising)
  • Passive sellers absorbed them at VAH (price stalls at the level)
  • Buying pressure did not translate into higher prices
  • Late buyers are now trapped above value
  • When CVD begins declining while price holds or drifts down, it reflects inventory shift to sellers

That’s classic absorption + exhaustion at a reference, not just a random delta divergence in the middle of nowhere—which is why this is tradeable.

Why the key reference matters (previous VAH)​


Institutions think in terms of:
  • value
  • inventories
  • responsive vs initiative flows
At previous VAH, responsive sellers are expected to participate:
  • above value = expensive location
  • counter-trend participants fade price back toward value
  • initiative buyers must prove acceptance above VAH to invalidate the fade
In your chart, they didn’t. Instead:
  • failed acceptance above VAH
  • reversion pressure back toward VWAP / POC returns
So the divergence here isn’t just technical—it’s auction failure at the edge of value.

Microstructure interpretation​

This divergence specifically suggests:
  • Buyers = aggressive but late
  • sellers = passive limit orders absorbing
  • liquidity = sitting above value, resting offers
  • breakout attempt = fails
  • market must rotate back inside value to find liquidity
That’s why this is one of the highest quality reversal contexts:

strong buying pressure + no price progress at a key level = trapped longs
 
Notice the following

1) After the first two (2) trades, the market transitions into a "Trading Range" Regime
2) Volatility is reduced, however institutions still have to move money and inventory
so a third setup occurs as they look to break to the upside, back into previous Value
3) We did not take this, because we are managing risk (protecting today's profits).

We do however continue to learn from what we observe.
We post the attached chart and on the right side, notice the 15 min time frame and
the previous Value Area (dashed lines). This provided part of the context that we are
always looking for (called confluence) in order to obtain the confidence to accept risk.

What we teach
1) Know what to look for ahead of time (anticipate)
2) Disciplined focus (Recognize the important signals)
3) Wait for the right context (at least two concurrent signals)
4) Enter with a stop in the right place
5) Enter with a profit target in a logical place, then "Clean Exit"

Retail traders, unless you can do this consistently, you will be consistent losers
No guarantees, this just gives you an edge that less skilled traders do not have.

Good luck
 

Attachments

  • Trade 3.PNG
    Trade 3.PNG
    125.7 KB · Views: 16
Here is a chart showing the "Front Side" of the US/Euro Overlap
Notice how volatility (and volume) subside temporarily as Euro
traders decide how to close their book of business for this session.
This usually lasts from 30 to 60 min. From this period we obtain
info that may lead to another leg or at least a way to identify
market direction (next regime) into the close
 

Attachments

  • US Euro Overlap Front Side.PNG
    US Euro Overlap Front Side.PNG
    118.5 KB · Views: 10
Last edited:
It has been quiet as usual during the "Dead Zone" however we remain
vigilant, and have added an Anchored VWAP at what we believe may be
the low of the session. This is a technique we attribute to Brian Shannon
and it is called "The Pinch".
 

Attachments

  • VWAP Pinch Example.PNG
    VWAP Pinch Example.PNG
    141.8 KB · Views: 13
Good Evening London Traders
I omit Euro traders because by now they are
out of the picture (it is 8pm in Berlin for example)

We are 60 minutes away from the final opportunity for US
traders. It is called the "Power Hour" and I do not recommend it
for amateurs. The opportunity lies in recognizing whether institutions
are placing more MOC orders on the buy or sell side at a specific time
9pm. In truth we suggest that retail traders stop at the end of the US
Euro Overlap, especially if there is no late session reversal. Its just not worth
the risk.

This will be our last chart. On the right side we show the positions of "trapped volumes"
on both sides. If a student were to concentrate only on identifying locations and times
where buy & sell side volume is trapped, in our opinion, they would significantly increase
their win rate. To do this requires patience and the ability to interpret CVD vs price at
specific locations on the chart. Takes time but it is worth the effort.

Good luck
 

Attachments

  • Trapped Volume Example 2.PNG
    Trapped Volume Example 2.PNG
    137.1 KB · Views: 16
A word about using "AI" to trade

So I have been hearing about traders who believe that "the secret" to success is
ChatGPT or Google AI. They seem to believe that once they have a basic concept
or indicator, they can use AI to improve it, and by questioning an AI agent, they can
bypass the heavy lifting and "Voila" they have created their own "ATM" machine

In my experience (and I have tried them out), speaking with an AI agent is similar to
speaking to a delusional "Idiot Savant" (by all means Google that phrase). You have to
be impressed with the volume of material that you obtain, BUT the quality of the information
is poor. In fact, I noticed that these AI agents, actually make things up as they go along
and although they present the material confidently, you end up finding out all too late
that most of what they say is error ridden crap. In my opinion, AI is no threat to a skilled
professional in any field of endeavor, and never will be.

Today I had a person attend my Zoom Meeting and make predictions based on ChatGPT comments.
One of those predictions matched my entry, the other(s) did not, and the result, significant (big) losing trades
however the user was still grasping at straws letting me know that it was just a matter of time
before they would be able to distill everything that I was speaking about into a single page PDF

I invited them (both the bot and the human being) back tomorrow, and I am really looking forward
to the day when a "bot" can anticipate "repetitive human behavior". I can guarantee it will not be
tomorrow.


🙂 Good luck
 
Last edited:
Good Afternoon London & Euro Traders

What a day. My power went down twice, leaving me stranded with position
in place on one occasion. Fortunately price action continued along a favorable
path. Because of stormy conditions here, I am tethering my IPhone to my
laptop so that I can maintain an Internet connection. I will post this and close for the day.

Posting my chart and trades. If there are questions I will come back at a later time to answer
 

Attachments

  • Dec 30 Trades.PNG
    Dec 30 Trades.PNG
    136.1 KB · Views: 13
Good Morning London & Euro Traders
It is 3:50am in The City

We attach a Chart that shows a 2 day view of price action
The Chart (called a "Markup") includes the Value Areas H/L, and
shows the previous day's AVWAP and VP, which provide the framework
against which institutions evaluate price action.

When looking at these charts, institutional professionals try to answers
to the following questions

1) Where was business being done previously, relative to key references on the chart
2) Where was price accepted or rejected previously (relative to these key references)
3) Which side is in control (aggressive buying or selling) NOW and the terms used are
"initiative or responsive".
4) Which side currently "owns" the risk (who is trapped)?
5) Based on the most recent previous session, where (relative to the key references) is price
likely to test next and where is price headed (higher/lower)

While the 2 day chart can help professionals to obtain answers to the first four (4) questions
the last requires a Daily Chart (also attached). AND the obvious answer to question 5 is "retest
of the previous high, and to the downside (look at the white line below current price).
Also it is reasonable to assume that Institutions would be interested in closing out the year
on a high point. The closest "high point" would be the "Big Round Number" 7,000.


Good luck
 

Attachments

  • 2 Day Markup Chart Example.PNG
    2 Day Markup Chart Example.PNG
    112.1 KB · Views: 10
  • HTF Chart.PNG
    HTF Chart.PNG
    171.2 KB · Views: 13
Last edited:
Good Afternoon London & Euro Traders
It is 12:20 in The City and we are getting ready for a bright new day

We attach a continuation chart (see the previous post)
and our comment identifying regime(s) for those interested
as follows
-------------
Current Regime
Regime Classification
Transitional to Bearish

  • The chart shows a range in Asia/London overnight on 29 Dec, followed by a mild bias up through London into early NY on 30 Dec.
  • After the NY session on 30 Dec, price clearly broke lower, lagging both the anchored VWAPs and the prior session’s POC.
  • The profile shape during NY 30 Dec shows low acceptance above POC, and developing extension to the downside — classic supply dominance entering thin holiday markets.
Interpretation:
  • Early sessions were neutral/rotational, lacking conviction.
  • The NY session on Tuesday 30 Dec exhibited distribution and lower value acceptance, indicating increased negative skew.
  • Anchored VWAPs are sloping down, reinforcing bearish drift.
Conclusion:

The regime is currently downtrend bias, driven by distribution in the NY session with poor responsive buying at higher levels.

Likely Price Path for the Next Session

Technical Drivers
  • Price is below multiple session VWAPs and poor follow-through above prior POCs.
  • Overnight activity into London shows lower swing lows, suggesting downside continuation pressure.
  • Holiday volume conditions = thinner liquidity, which often exaggerates moves and allows trend continuation.
Expected Path

Primary Scenario (High Probability):

Continuation Lower — Expect test of recent lows and possible probe into lower volume nodes.

  • Extensions below the NY 30 Dec low.
  • Rally attempts likely capped near anchored VWAP clusters (failed retests = bearish confirmation).
Alternative (if corrective):

Range Expansion Up into Anchored VWAP only IF supported by volume.
But volume historically dries up sharply in these holiday sessions.
Key Levels
  • Upside Hurdle: Near Monday/Tuesday POCs and Anchored VWAPs (~6950–6955ish zone on the chart).
  • Downside: Recent NY low and unfilled lower volume area (~6920–6900ish).

Because Dec 31 is New Year’s Eve, CME Globex and CME cash sessions typically have early closes:

  • Equity index futures have early close at 1:00 PM EST on 31 Dec (instead of normal 4:15 PM close).
  • Often reduced liquidity from the start, particularly after 8:30 AM EST.

Implication:
Lower liquidity → wider spreads → potential sharper moves. Institutional execution algorithms will be pulling liquidity earlier.

Institutional Player Expectations

Sell-side Incentives Overnight Into NY
  • Risk managers prefer delta neutral or reduced exposure entering early close holiday.
  • That pattern supports distribution and downside bias, not accumulation.
Pre-open Bias
  • Given distribution and no successful acceptance above main anchors, the bias into the early NY open is bearish skew.
  • Any rally is likely sell-on-rise into structural VWAP / POC.

Based on the data to this point in time, we project the following "Primary Reference Levels". These levels are what Institutional
traders are going to be watching as the next session begins AND they are projected from the visible 24 hour Auction on the chart

  • 24h Value Area High (VAH) → ≈ 6958–6962
  • 24h Point of Control (POC) → ≈ 6950–6952
  • 24h Value Area Low (VAL) → ≈ 6942–6944
Quick Institutional Playbook

Bias: bearish continuation unless acceptance above 6955–6960

Preferred trades next session
  • short the rally
    • entry zone: 6950–6958
    • stop acceptance above 6962
    • target 6920 → 6908 → 6900
  • avoid chasing lows on first break
    • wait for weak bounce
    • sell into VWAP / POC resistance
This is the Complete Pre-Session Briefing that we develop and provide our students prior to the NY Open
It is also what we teach them to do, so that (in theory) they can eventually become independent
of my influence and create their own (presumably successful) business plans going forward. Our goal for
students is to learn this process in about 60 days depending on each student's background and motivation.
We will NOT be presenting it in this detail again, reserving it for class participants only.

Good luck
 

Attachments

  • Mon Dec 29 Tues 30 Asia & London.PNG
    Mon Dec 29 Tues 30 Asia & London.PNG
    132.2 KB · Views: 10
Last edited:
Interesting Open

Referring to the previous post above, we show the trading plan outlining
areas to short 6,950 (at the POC) and so we did just that, looking for a move
lower at the open

As you can see, this worked well, whether you took the aggressive entry prior
to the open or waited for the open, you still had a nice opening profit.
Now we wait for next "move"

Notes

Continuing to experience technical difficulties with microphone and speaker issues.
and windy conditions here in CA have caused another outage. We are on emergency power
and tethered. Not a good feeling.

Still lots of copy traders, and again we cautioned against it as we do not want to
provide a signal service. That is what seems to have happened this morning
We are up +20 net of commissions and will now stand aside (to protect profits)
 

Attachments

  • Pre-Open Trade.PNG
    Pre-Open Trade.PNG
    125.9 KB · Views: 13
And we paused our webinar to create this chart,
showing the Retail version of our short entry.

1) As can be seen on this chart, price "takes out"
the Value Area Low, then the next bar retests it
2) When you see that retest and fail. you KNOW this
is going lower. High probability short and hold for
at least +5, leaving one to run lower to +10

If there were a "text book" short to take at the open
this would be it.

Although we did not annotate the Value Area, it is the dashed blue lines overhead

Good luck
 

Attachments

  • Retail Entry off the Open.PNG
    Retail Entry off the Open.PNG
    135.2 KB · Views: 9
And a final post (we think) because power is out again
here in my neighborhood, and again I am running my
house on generator.

This trade is a "leg 2" setup, and it is also a high probability
trade, nevertheless, we reduced our position size because of the
timing of the entry (at the end of the Initial balance).

Good luck
 

Attachments

  • 2nd Trade Dec 31.PNG
    2nd Trade Dec 31.PNG
    146.7 KB · Views: 13
We have been testing (with inconsistent result) live streaming on Twitch using
the name Steve46Trades.

For those who may have been watching, this is how our display should have looked
and thanks for your patience as we work through the challenges

Today was a good day in terms of 1) planning 2) creating an accurate trading plan
and 3) execution of the plan. We may record part of this session, posting it here later
for interested viewers.

We will continue to post content so that the kind folks at this site can derive value from
additional visitors to the site

Good luck
 
Hello Steven can you explain to the people who read this thread why they should be trained by you when they can just buy books how to intetpret volume with a few dollars?
 
Back
Top