You are using an out of date browser. It may not display this or other websites correctly.
You should upgrade or use an alternative browser.
You should upgrade or use an alternative browser.
Hello Trader333
Thanks for being kind (and posting a "like")
I post this because (if you review the previous comment)
I suggest that the upside from the "news" (Courts blocking
Trump Tariffs) would continue. Obviously I was wrong
What I want to show you (Paul), is that even when you are wrong
using this system you have a "2nd chance" to make money...How you may ask?
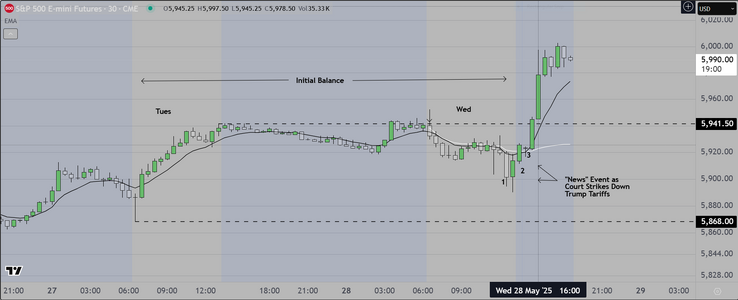
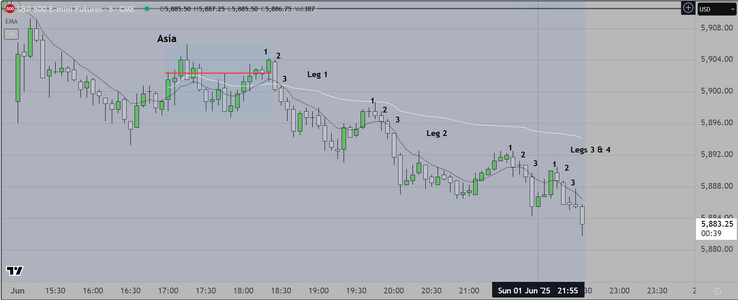
Looking at the chart below, notice that I label the initial open and the bars that
follow as "Leg1"....This is why we ask retail students to refrain from trading AT
the open, and instead to monitor only. What you see is something that I teach
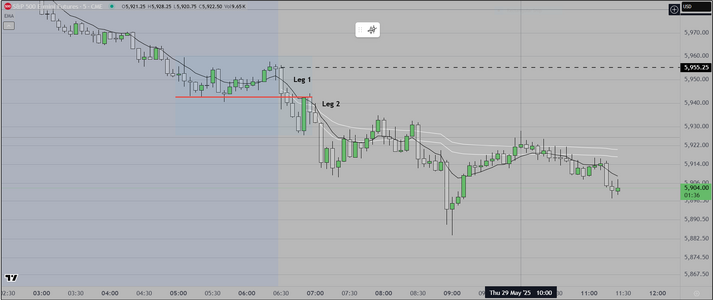
and that is to observe formation of "Leg 1" and THEN to trade "Leg 2" because the
odds favor a continuation entry. Same Setup (1-2-3)
What I am discovering during my weekend analysis is that, there are often multiple
"Leg 1-Leg 2 setups" on the 5 min time frame.
Good luck
Thanks for being kind (and posting a "like")
I post this because (if you review the previous comment)
I suggest that the upside from the "news" (Courts blocking
Trump Tariffs) would continue. Obviously I was wrong
What I want to show you (Paul), is that even when you are wrong
using this system you have a "2nd chance" to make money...How you may ask?
Looking at the chart below, notice that I label the initial open and the bars that
follow as "Leg1"....This is why we ask retail students to refrain from trading AT
the open, and instead to monitor only. What you see is something that I teach
and that is to observe formation of "Leg 1" and THEN to trade "Leg 2" because the
odds favor a continuation entry. Same Setup (1-2-3)
What I am discovering during my weekend analysis is that, there are often multiple
"Leg 1-Leg 2 setups" on the 5 min time frame.
Good luck
Attachments
RolloTape2025
Active member
- Messages
- 116
- Likes
- 27
Nvidia earnings might have helped a bit too 🙂Some readers may know of the "News Event" that dropped after the close of the NY session
(Trump's tariffs struck down"). We assume that this effect will have legs and continue into
the next session and beyond.
Last edited:
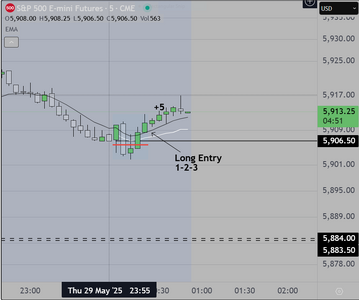
London Session opened less then an hour ago
and already we have +5 on a small scalp at the open
We have a person sitting in from our first class, and
they are going to try out this simplified version of
our original VWAP envelope. This version requires
only the Ema, AVWAP, FRVP, and the ability to learn
the system rules, and wait patiently for the setups
to present.
Here is the chart
Attachments
Last edited:
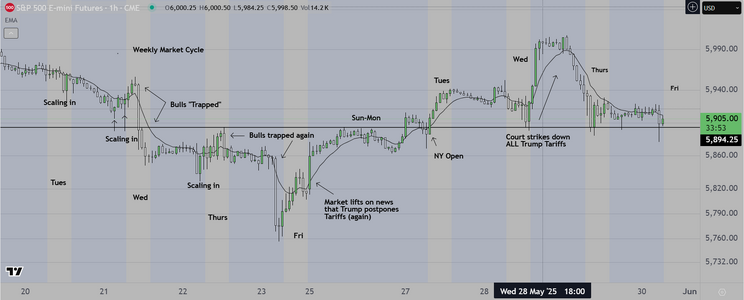
We attach a chart showing what professionals call the "Backend" of the Weekly Cycle
"Reset Wednesday" is the start of this side of the cycle. On Wed, institutions look at price
in relation to previous highs/lows, THEN they will either "Dump" inventory (as they did this
week) followed by moving price up ("Pump") where they will accumulate and later sell during
the "Off Hours" (at or near the close of London Session). This cycle can and will reverse of course.
The attached chart also shows the obvious (multiple) tests of the "Reset" low. Notice that at each
retest, buyers came in to defend and also to add to their long inventory. THEN TODAY, we saw
institutions move the market down, convincing everyone that the market was headed lower, only
to reverse, TRAPPING bears who will now have to decide whether to buy back their shorts and get long
or to scale in. If they decide to buy back shorts, the market is going to continue up
Earlier today, as we watched this unfold, we took a long scalp, then waited while the market opened
and dropped. I had several former students watching along with me, some of them took the short
trade and made money. I waited for the retest of the lows.
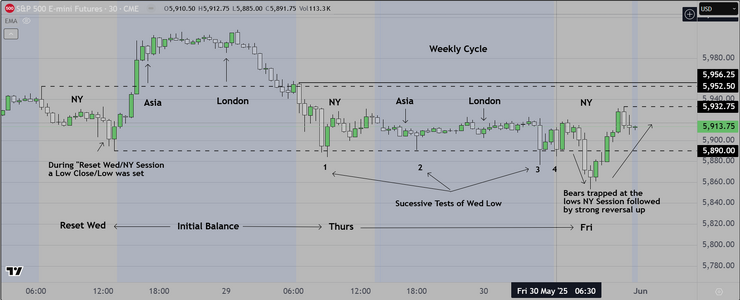
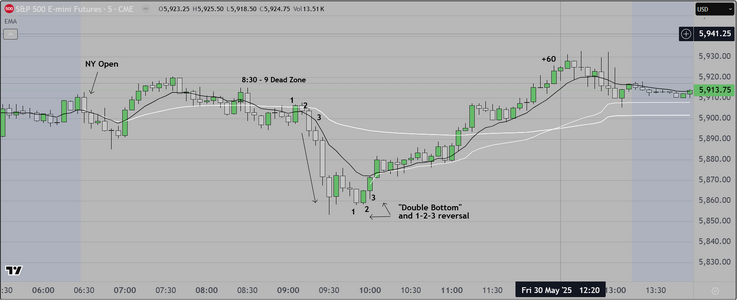
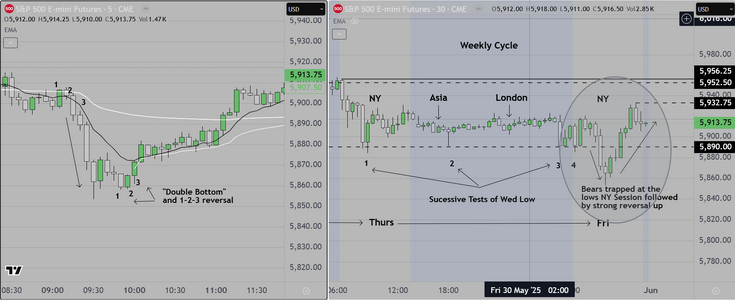
Here are two charts, one showing the "big picture" the other showing today's session and showing
the reversal. HERE IS HOW YOU GO FROM LOSING TO WINNING.
1) Learn to see the big picture (keep the weekly chart in front of you) so that you can anticipate where
the big institutions might move the market.
2) When you see a breakout (up or down) check your Weekly Chart. How likely is it that this breakout will
continue?
3) All of this is about awareness of the context. Professionals operate from the big picture chart, and they
while they DO trade the false breakouts (for scalps), they KNOW that the real money is made by catching
the reversal. This one was worth +60 pts.
Final Note
I woke up and saw this developing scenario and made the necessary changes to my trading plan
and when my friends saw this they said, "how confident are you that this WILL happen?"
I replied, I can tell you that I have seen it before many times. I don't know if it will play out
but if it does, at least you will start to recognize it sooner, because it is on your radar NOW
Lets watch and see
"Reset Wednesday" is the start of this side of the cycle. On Wed, institutions look at price
in relation to previous highs/lows, THEN they will either "Dump" inventory (as they did this
week) followed by moving price up ("Pump") where they will accumulate and later sell during
the "Off Hours" (at or near the close of London Session). This cycle can and will reverse of course.
The attached chart also shows the obvious (multiple) tests of the "Reset" low. Notice that at each
retest, buyers came in to defend and also to add to their long inventory. THEN TODAY, we saw
institutions move the market down, convincing everyone that the market was headed lower, only
to reverse, TRAPPING bears who will now have to decide whether to buy back their shorts and get long
or to scale in. If they decide to buy back shorts, the market is going to continue up
Earlier today, as we watched this unfold, we took a long scalp, then waited while the market opened
and dropped. I had several former students watching along with me, some of them took the short
trade and made money. I waited for the retest of the lows.
Here are two charts, one showing the "big picture" the other showing today's session and showing
the reversal. HERE IS HOW YOU GO FROM LOSING TO WINNING.
1) Learn to see the big picture (keep the weekly chart in front of you) so that you can anticipate where
the big institutions might move the market.
2) When you see a breakout (up or down) check your Weekly Chart. How likely is it that this breakout will
continue?
3) All of this is about awareness of the context. Professionals operate from the big picture chart, and they
while they DO trade the false breakouts (for scalps), they KNOW that the real money is made by catching
the reversal. This one was worth +60 pts.
Final Note
I woke up and saw this developing scenario and made the necessary changes to my trading plan
and when my friends saw this they said, "how confident are you that this WILL happen?"
I replied, I can tell you that I have seen it before many times. I don't know if it will play out
but if it does, at least you will start to recognize it sooner, because it is on your radar NOW
Lets watch and see
Attachments
Last edited:
This should finish my project, showing traders how to make the transition
And the way you do that is to change
1) How you see the market (the Big Picture)
2) What you focus on (Weekly Cycle)
3) Changing the way you think about trading
The markets are controlled by big banks and brokerages
The operate on larger time frames (hourly, daily, weekly, quarterly, yearly)
If a trader operates strictly on a minute based time frame, they will be
consistently "trapped" into losing positions, and out of, winning ones.
Its that simple.
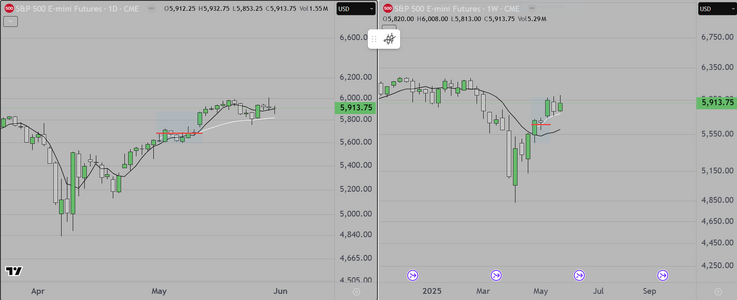
The attached chart shows one option for retail traders to use as a screen display
The second option is simply a screen showing daily and weekly candles. I am
skeptical that anyone will take the time to look closely at the daily/weekly chart
and yet, in many ways, it is the most important chart for skilled professionals.
Using these longer time frame charts, pros can figure out what the institutions
are doing, the general direction they intend, and most importantly the timing
because they have to report earnings at specific intervals.
One final anecdote, it was Richard Dennis who said that "he could publish his
entire system rules in the daily paper and no one would follow them". My experience
suggests that this is largely true.
That's about it I will try to check in to answer (some) questions.
Good luck
And the way you do that is to change
1) How you see the market (the Big Picture)
2) What you focus on (Weekly Cycle)
3) Changing the way you think about trading
The markets are controlled by big banks and brokerages
The operate on larger time frames (hourly, daily, weekly, quarterly, yearly)
If a trader operates strictly on a minute based time frame, they will be
consistently "trapped" into losing positions, and out of, winning ones.
Its that simple.
The attached chart shows one option for retail traders to use as a screen display
The second option is simply a screen showing daily and weekly candles. I am
skeptical that anyone will take the time to look closely at the daily/weekly chart
and yet, in many ways, it is the most important chart for skilled professionals.
Using these longer time frame charts, pros can figure out what the institutions
are doing, the general direction they intend, and most importantly the timing
because they have to report earnings at specific intervals.
One final anecdote, it was Richard Dennis who said that "he could publish his
entire system rules in the daily paper and no one would follow them". My experience
suggests that this is largely true.
That's about it I will try to check in to answer (some) questions.
Good luck
Attachments
Last edited:
RolloTape2025
Active member
- Messages
- 116
- Likes
- 27
Sorry if I missed it earlier in the thread. What is your typical initial stop size, and typical loss size? Your profit size I have seen is typically +10, +20
There is no typical size. It depends on where price is in the distribution. Traders may not
understand that stops are "hunted" by institutions. If you put a stop in the obvious place
the odds of getting hit are high.
AND finally, success is in part about changing the way you think. Its not about winning or losing
its about what you have to spend to make money, and how to view expectancy. If you concern
yourself with short term results you will always be caught in the short term randomness of the market.
If instead you find a system approach that has an edge, then over a period of time, you will see that
edge play out. Retail traders trade by the seat of their pants never knowing what their expectation is
and that is in part why they almost always lose. I was gratified to learn that some of my early students
have seen results in line with my system, suggesting that they are operating in a disciplined way.
Last edited:
RolloTape2025
Active member
- Messages
- 116
- Likes
- 27
Yes of course.There is no typical size. It depends on where price is in the distribution. Traders may not
understand that stops are "hunted" by institutions. If you put a stop in the obvious place
the odds of getting hit are high.
AND finally, success is in part about changing the way you think. Its not about winning or losing
its about what you have to spend to make money, and how to view expectancy. If you concern
yourself with short term results you will always be caught in the short term randomness of the market.
If instead you find a system approach that has an edge, then over a period of time, you will see that
edge play out. Retail traders trade by the seat of their pants never knowing what their expectation is
and that is in part why they almost always lose. I was gratified to learn that some of my early students
have seen results in line with my system, suggesting that they are operating in a disciplined way.
So with expectancy, you need to know what the average loser is. What is the initial stop loss on a trade, and more importantly what is the average loser.
The average changes from week to week depending on the type of price action. but I have already said that haven't I.
Last week the initial stop loss was approximately 8 pts and the average loss was $350, and that is because I am able to
see when I am wrong and exit sooner than my stop. It is also important to note that the "fill" affects the size of loss as
well and that cannot be quantified.
Thanks for giving me a "peek" into your mindset. Now I am clear on what is important to you.
RolloTape2025
Active member
- Messages
- 116
- Likes
- 27
Makes sense. Thank you.
Hello,
Interesting development since I last posted. A small group of
traders contacted me to say that my system didn't actually work.
They suggested that they tried it out in the Asia market and it did NOT
work. I brought them in (virtually of course via Zoom) to watch me trade
tonight's Asia Market. Here is the markup (the Market is still "in play").
My comment is simple. Markets are fractal. If a system has an edge, that edge
works in all liquid markets. If the liquidity dries up, then EVERYONE has a problem
and should probably try trading options instead of shares or contracts.. Fortunately
that hasn't happened. To determine if a market is "in play" simply check out the
pending economic news. THAT is what motivates the institutions to put money to work.
Posting tonight's chart. The people watching me had many questions, however I was not
in the mood to answer them. What they were doing was taking screen shots of my
display, then trying to use the information as if it were an ATM......it doesn't work that way.
Its not "plug & play".
While I am still finishing rebuilding my home, I won't have time to hold another class
I will check back if/when that changes.
Good luck
Attachments
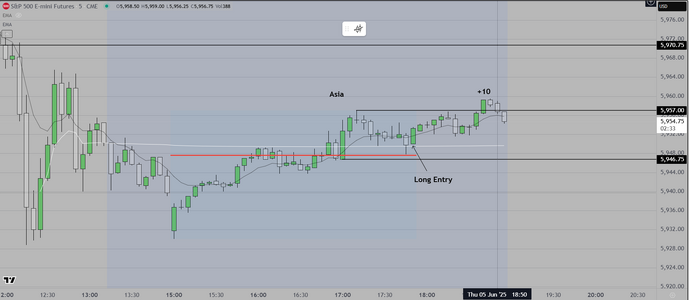
Another example showing the Asia Session
Most of the movement is in response to news
(as was mentioned previously). I simply monitor
and respond
Important to know where to anchor the tools and
(as usual) one has to be disciplined, managing trades
in a reasonable way.
This trade shows the Asia open, the initial balance
and the statistical skew. The trade is based on the
idea that markets are forward looking
Good luck
Attachments
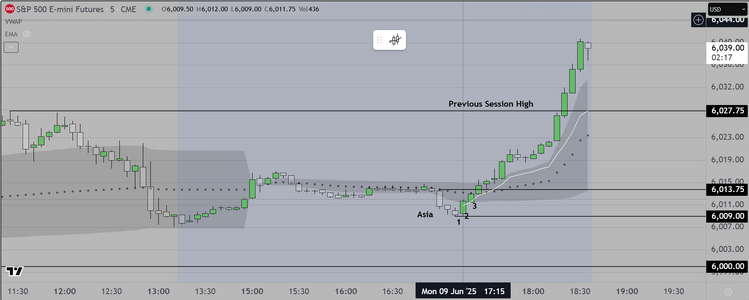
On the West Coast US (Los Angeles area) we see news reports of
civil disturbances with people protesting activities of federal agents
who have been removing illegal immigrants from California
So that is the news
The chart attached below, shows what we have mentioned several times now
and that is that the financial markets are "forward looking". Review of previous
posts shows the same basic process.
Observant readers may notice that for this chart I am using my favorite screen
display, which is a VWAP envelope. I like it. It is clear to me and easy to make
good decisions.
On the chart you can see an initial move (higher) right after the start of
the Asia Session. The profit target is (to us) obvious and that is the previous
session high.
Attachments
Last edited:
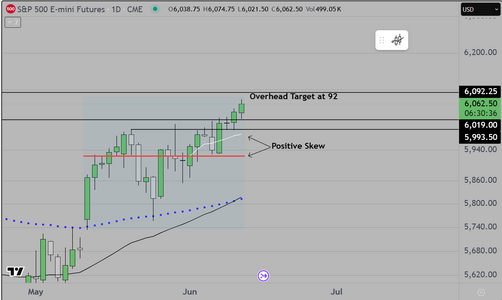
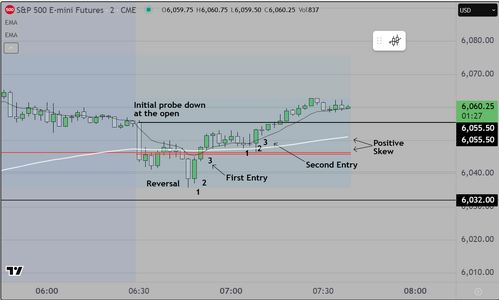
Today we post two (2) charts, the first showing daily candles and we have our
overhead profit target marked at 92. Professionals look at fluctuations in volatility
to determine the probability of price getting there during a given session.
The second chart shows price action on a 2 minute basis. What readers can see
is that on the open, price probed down, the reverse as institutions came in to lift
the market higher (towards our overhead target). Professional operators see this
as basic and easy to trade. you get in either at the first or second entry and you hold
as long as the market continues to show momentum
In an effort to help those who struggle, we suggest reading the previous posts. As mentioned
the markets are "forward looking", and so we survey the social and political scene and determine
that pending events favor the upside as the US president attempts to create positive news
dealing with China and his own political problems in California and across the country
On the economic side, inflation has yet to show the negative effects of tariffs, but we believe
it is just a matter of time before we see problems with both the US economy and other
countries (including UK) who may be affected by these policies. Again we show traders how
to plan for these contingencies. Smart traders may want to consider how long they can wait
before they create a 2nd stream of income? This may be the way to do that.
Postscript
For those interested in financial security, I have a couple of thoughts as to how to view
the subject of obtaining training for a possible career in this industry
One of the primary issues struggling traders face is mental, specifically the issue of confidence
If when you look at the screen you are uncertain, because you are often wrong, you are in good
company. I remember that feeling. What you may want to consider is what can be done to change
that. The goal is to look at a chart and see opportunity, not uncertainty. The three step process
that worked for me was 1) Quality education, 2) Good practice and 3) Experience.
Today was for me an example of how this can work. Students from my first class visited and watched
me trade. At the first entry, several traders commented that when they looked at this screen they
mainly felt uncertain. I said that when I look at the screen I see opportunity based on my evaluation
of the probabilities (the simple math). I referred back to the skew. It went from negative to positive
and when it did, I entered. Experience comes in to play after that. Knowing that I was on the same
side as the institutions, I felt good (strong positive feeling) about holding my position long enough
to reach my target(s). When I did cash out, they said that they saw what I did, but NOT SOON ENOUGH
and that is the reason I bring up the subject of experience. In my opinion you have to see it done by
a skilled person, before you can believe it is possible. I enjoy demonstrating that skill.
Good luck
Attachments
Last edited:
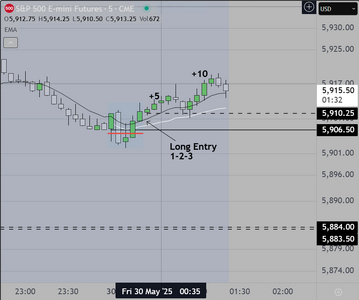
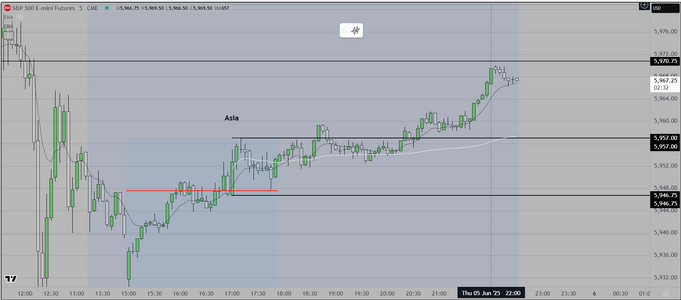
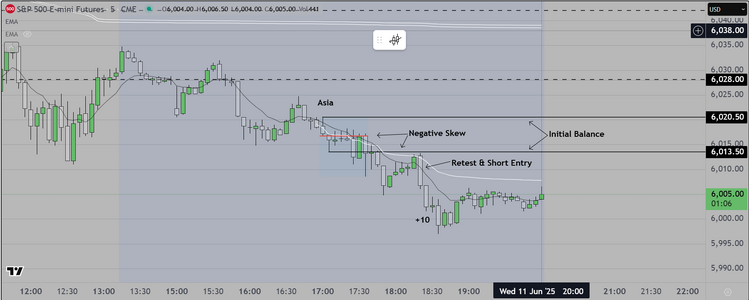
Here we are again and I am posting a 5 min chart showing the Asia session
Same tools, same strategy and same result (+10 pts)
Review of the previous posts should provide confirmation that this strategy
continues to work. This is not a surprise. It was used by my mentor and the
only difference was that he added a VWAP envelope.
For struggling traders, I hope you can see how similar these charts are. Now the
question is do you want to continue to trade in a way that loses money, OR
would you be willing to learn something new, and in the process create
a sustainable business model?
Attachments
Similar threads
- Replies
- 5
- Views
- 4K
- Replies
- 3
- Views
- 4K