A Professional Approach to Trading Futures

I am done for the session and wanted once again to
post this for Trader333

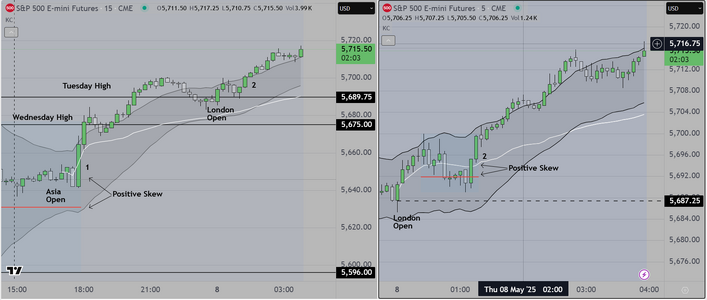
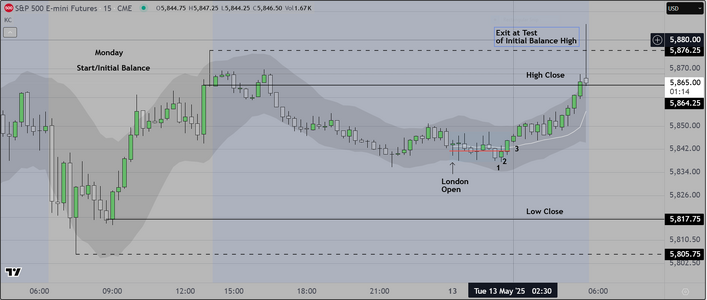
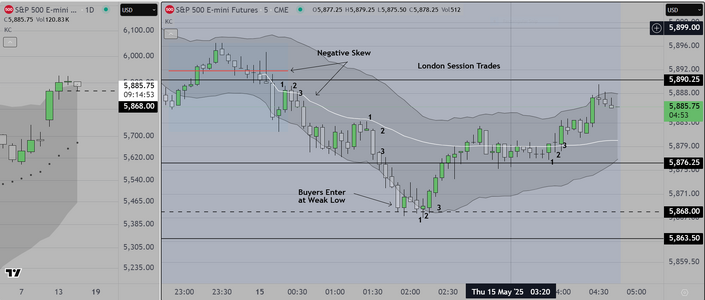
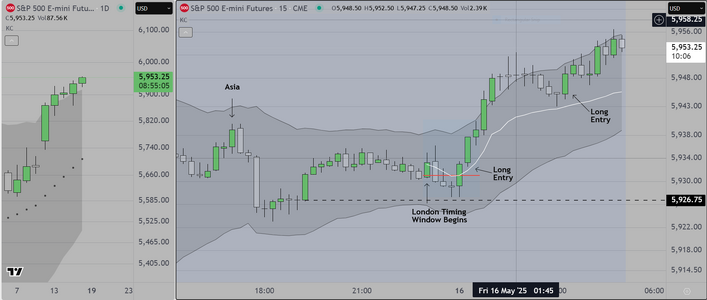
The attached chart shows two (2) views, on the left
using 15 min candles, we show the Asia session as traders
"Lift the offer". For those who may not have the skills, this means
that institutions and professionals alike are buying the asking price
because they are aggressive (they really want to get long). WHY?
Because President Trump promised "Big" deal announcement and
the markets are "buying into" the possibility that he actually HAS
made deals that will reduce the need for tariffs. I am not a big fan
of this person, but what matters is not my politics, but what the big
Asian and Euro banks think, and it was easy to anticipate that this
is what would happen. My strategy was to get long WITH those
institutions and get paid during Asia and London, then to wait to
see what (exactly) the "big" deal is. I won't be trading the NY session.
So far I am up +40

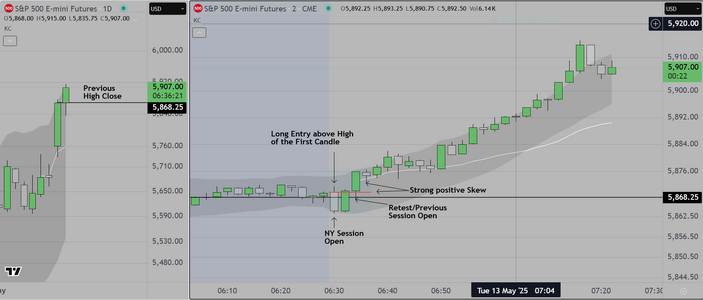
On the right is the 5 min chart showing the London session. Same tools
Same approach, Same result.

Trader333, in terms of success, what really matters is accurate evaluation
of context (news), THEN, can you predict how markets will respond? Any
amateur who wanted to know in advance what might happen, only had
to check out the comments offered by Google's AI engine. It supplied
the information about the probable response to this event yesterday.
Plenty of time to figure out a trading strategy. Used to be that I had to
call "friends" to ask what they thought. No longer necessary.

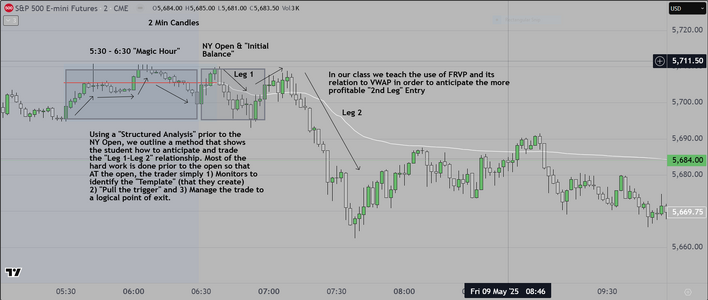
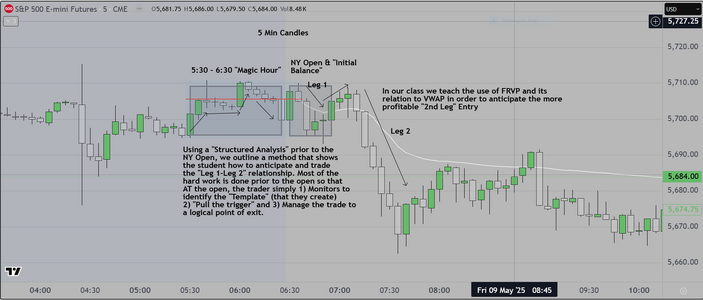
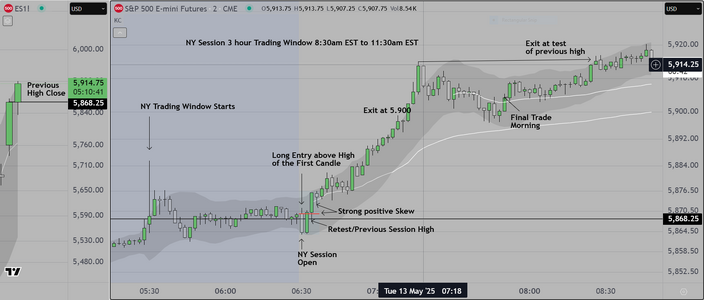
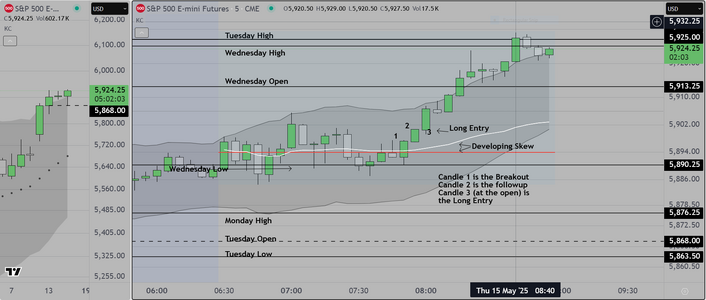
The display is simple to figure out, the only technically demanding issue
is to learn where to anchor the tools. Once you have that in place, you can
see where the entries are, you get long, you hold to +10 and +20, then as
I have said previously "you get paid and you get out". That is the job.

By the way, this approach works like a charm for any index including FTSE
and DAX.

Good luck
 

Attachments

  • Asia to London Trades.PNG
    Asia to London Trades.PNG
    143.1 KB · Views: 42
I thought this necessary to show folks what I am doing with respect to
my simplified course of study

Trader333, you of all people have stayed engaged and you have the requisite
background so if you wish, you have a place in the class. Your prerogative of course

This is as simple as I can make it, and to be perfectly honest, while doing this I learned
that this is actually superior to the method that I originally learned years ago.

The trader engages at specific times and only if a "Template" is generated, suggesting
that the odds of success are high. Other than that they stand aside and wait for the right
conditions to occur. As mentioned, the real work occurs during the weekend, when the students
learn "Structured Analysis", which produces data as to "what worked" and (more importantly)
what looked good initially, but was actually institutions trapping traders (out of good trades
and into bad trades). By shifting the distribution of good and not so good trades, the struggling
student learns something quite valuable, and that is that they can make money in two ways
first by reducing losses, then by improving their ability to determine what constitutes a "good trade".
As they learn to do both, they also see that it is possible to create a viable business model (if that's
what they want).

My objective is to provide the tools and the training necessary to reduce the time it takes to get
to the point of profit OR if that isn't possible, to at least give the trader the knowledge that short
time frame trading isn't for them, and that it may be better to switch to a longer time frame or
hire others to manage their portfolio (if they have one).

Students who apply will be sent a questionnaire. I will require students to show a reasonable acquaintance
with math (statistics). I will also request information about a person's ability to accept risk. Those two areas
are non-negotiable (for me). Finally upon acceptance I will also require a signed NDA (Non Disclosure Agreement)
so that "students" do not engage in resale of my intellectual property.

This has been fun and rewarding. Trader333 it would be fine with me if after a short while you removed the thread
It is up to you and the administrators of this site. I won't be doing this again.

Good luck/Good bye
 

Attachments

  • Final Post.PNG
    Final Post.PNG
    127.9 KB · Views: 18
  • Final Post 5 min Candles.PNG
    Final Post 5 min Candles.PNG
    129.1 KB · Views: 17
Last edited:
Good Morning from the West Coast US where we had a
pleasant time trading the London Session

We post an example of the Simplified system. The result is
predictable. How is that? Well for starters, we begin by
evaluating "Context" (news) and that is simple because
of the obvious issues.

1) The American president postponed tariffs for 90 days. What a
surprise? The "obvious" response is that the markets moved higher,
providing institutions (and those who were "informed") with the
opportunities to make short term profits, trading specific stocks
and of course, indices.

2) Skilled participants evaluating price action prior to the "postponement"
saw institutions staging inventory and got on board. Those without the
same experience or skills are (to some extent) already "trapped out" and
they will end up "chasing the market" in which case the odds favor continuation
(for the moment).

The attached chart show the range starting Monday (creation of the weekly "Initial
Balance"). As mentioned, the general rule is not to countertrend trade during this
time period.

We show the single trade, which is logical and aligns with the trend

Trader333, we continue to be busy supervising the rebuild of our home and so we
cannot know (exactly) when we will conduct another class. We will however, send you
a summary of the "Simplified System" and you can try it out (if you wish) to see if it
suits your temperament.

Good luck
 

Attachments

  • Siimplified System Example.PNG
    Siimplified System Example.PNG
    102 KB · Views: 15
and this followup shows the exit of the trade entry
show above as institutions take profits at a test of
the Initial Balance High.

This should show struggling traders the importance
of have a framework that makes sense (and most importantly)
aligns with what is actually happening on the institutional
side. Why? Because these people are controlling the markets.
Unless you understand what they are doing, you will lose
as do most traders (about 90 percent by many estimates).

We are flat and will watch the NY session open and trade
however we have profits to protect, and we will tend to be
very selective (if we enter a trade)

AND the reason we will be selective, is that whenever you see
a spike move, as we just had in the London Market. It tells you
that the institutions can (if they wish) reverse the market but
first you will see an engulfing bar that foretells the move back
down. Skilled traders know this and will wait to see if that happens
at the NY open.

Good luck
 

Attachments

  • Exit Test of Initial Balance High.PNG
    Exit Test of Initial Balance High.PNG
    99 KB · Views: 14
Last edited:
This followup to show that there was no engulfing candle
instead we saw continuation

The chart shows the very simple and easy entry after the second candle
and aligned with the positive skew. Everything pointing up
 

Attachments

  • NY Session Open Simple.PNG
    NY Session Open Simple.PNG
    107.8 KB · Views: 13
This is the end of the three (3) hour NY session Trading Window

We teach traders to only trade at specific times. This is in part about
risk management, and about using times of high volatility to maximize
profits.

The attached chart shows the three hour window, that starts at 8:30am EST
and extends to 11:30am EST. The first hour is called the "Magic Hour" because
Economic News is often released at this time causing spikes and exaggerated moves.
The second hour starts with the open of the NY session at 9:30 EST. It is during this
time period that skilled traders use training, experience and skill to work to obtain
at least one (1) profitable trade, targeting +10 pts.

Today we saw two (2) reasonable trades, both winners based on the simple Algo entry
that is preferred (because of the high odds of success).

The simplified method starts with analysis of previous price action and context (news)
followed by setting up charts and monitoring price action prior to the open of the trading
window. The trader develops a template or pattern that they can use to identify what to do
as the market opens and develops through the first 15-50 minutes. Depending on what they
see, and recognize, they can enter looking for a swing +10 pts or if that is not possible they
can "buy a stop" and exit with a scalp profit.

This simplified model lends itself to any liquid market and can be learned by motivated persons
who want to create a sustainable career.

Good luck
 

Attachments

  • NY Session Trading Window Example.PNG
    NY Session Trading Window Example.PNG
    132.1 KB · Views: 18
This is the end of the three (3) hour NY session Trading Window

We teach traders to only trade at specific times. This is in part about
risk management, and about using times of high volatility to maximize
profits.

The attached chart shows the three hour window, that starts at 8:30am EST
and extends to 11:30am EST. The first hour is called the "Magic Hour" because
Economic News is often released at this time causing spikes and exaggerated moves.
The second hour starts with the open of the NY session at 9:30 EST. It is during this
time period that skilled traders use training, experience and skill to work to obtain
at least one (1) profitable trade, targeting +10 pts.

Today we saw two (2) reasonable trades, both winners based on the simple Algo entry
that is preferred (because of the high odds of success).

The simplified method starts with analysis of previous price action and context (news)
followed by setting up charts and monitoring price action prior to the open of the trading
window. The trader develops a template or pattern that they can use to identify what to do
as the market opens and develops through the first 15-50 minutes. Depending on what they
see, and recognize, they can enter looking for a swing +10 pts or if that is not possible they
can "buy a stop" and exit with a scalp profit.

This simplified model lends itself to any liquid market and can be learned by motivated persons
who want to create a sustainable career.

Good luck
Hi Steven,
Really appreciate what you are doing. Recently I have been following your post and reading slowly as I really want to succeed in this field. Coming from technical background (Software Engineer). I am one of those guy who fall into 99% failed trader category. Of course lost money for the last 5 years and now in a position where losing my confidence and getting demotivated and started questioning myself if I will ever see myself to succeed in this field.

So I have some general questions.

1) Is your trading educational materials suitable for day trading futures along side with a full-time job like me? If so, what approach one should take if he has a full-time job and wanted to day-trade futures in NY session?

2) How much profit target one can expect per day with the 3k capital by following your trading methodology? I mean risk and reward ratio per trade for 3k account.

3) If someone want to seriously learn from you and wanted to make it as a career. Is there any chance?

Thank you,
 
Hello Adnan

Thanks for your kind comment

As you may know, this thread was started as part of an obligation I have to
my mentor, to give back to retail traders, to tell them the truth about how
day trading actually works (in sharp contrast to what they may think).

The bottom line is that I have an advantage (education) and have used it, primarily to
1) manage my own family's portfolio which operates on multiple time frames
and secondarily 2) to operate on a "daily" time frame (as a day trader) with
the mandate to make money CONSISTENTLY.

For those who may have an interest in transitioning from net loser to winning
consider the following;

If you check the Internet listing for any top tier firm (try Goldman Sachs or JP Morgan
for example), you can find their trading results (trading only) for each year by
looking at the "10K SEC Summary Report". For each year, they show the number of
winning days vs losing days, and how much they make. The obvious question is 'How
do they do that"? AND the answer is that they do the opposite of what retail traders
do every day.

One of the best examples is as follows. Day Traders will wait for a high impact economic
release (GDP, Employment, Interest Rate Decisions) and they will jump on it right after
the event, looking to make a short time frame profit. At the same time, the top tier firms,
have been making profits for months prior to this "Event" and when news is released, use that
volatility (and the liquidity it produces) to TAKE PROFITS on previously established positions.
This is why I start by focusing on longer time frames, toggling to shorter time frames at specific
intervals, to learn WHEN (on what time frame) the top tier firms are moving markets in order
to reach their time based (monthly and quarterly) financial reporting deadlines.

One can only hope that some of you can see how this might be a game changer for traders.

As mentioned I will not be continuing much longer and I have already suggested to Trader333
that it would be fine with me, if he were to remove the thread after I am gone.

Good luck
 
Last edited:
Hi Steven,
Really appreciate what you are doing. Recently I have been following your post and reading slowly as I really want to succeed in this field. Coming from technical background (Software Engineer). I am one of those guy who fall into 99% failed trader category. Of course lost money for the last 5 years and now in a position where losing my confidence and getting demotivated and started questioning myself if I will ever see myself to succeed in this field.

So I have some general questions.

1) Is your trading educational materials suitable for day trading futures along side with a full-time job like me? If so, what approach one should take if he has a full-time job and wanted to day-trade futures in NY session?

2) How much profit target one can expect per day with the 3k capital by following your trading methodology? I mean risk and reward ratio per trade for 3k account.

3) If someone want to seriously learn from you and wanted to make it as a career. Is there any chance?

Thank you,
Hello Adnan

It seems to me that every important goal in our lives requires commitment first and foremost
Also, it is important to note that we all have different skills and talents. I think the best way to
proceed is to take stock of your talents and decide if you are suited to this profession. I ask every
student of mine to do this and to be honest with themselves.

To be successful, it is clear to me now that you will need a basic background in statistics. That is
relatively easy to obtain. After that it is helpful if you have a history of success at work, and that
you are willing to make changes as necessary to your personal schedule. For example, I do most
of my preparation during the weekend. It takes me about an hour, and during that time I evaluate
the previous week's price action and I create a list of "what worked" (setups that worked) as well as
those that did not and I try to understand why. What I have come to understand is that the markets
are always looking to "trap" traders, into bad trades and out of good ones.

I use only a couple of tools, none of which are common to retail traders. I try to explain the basics
in a way that makes sense. I am often asking students that very question "does this make sense to you"?
In general, if you learn a method that has an edge (statistically) and you do reasonable things as you trade
over time that edge will be seen as profit, that is to say, you will (probably) make more than you lose
As everyone can appreciate, random chance exists and some folks do experience what we can only
characterize as "bad luck" (a series of consecutive losses for example). I have certainly had that experience.
As you learn, develop experience and apply discipline, the percentage of winners should improve. I noticed
that my mentor would lose money periodically on a daily basis, but very rarely on a weekly or monthly basis.

As regards my intention to conduct class, I have a problem currently and that is that I am rebuilding my home
which was lost in a fire. As I move forward I will try to find time to hold a class and if you are interested I will
send you an application. In the meantime, it may be a good idea to work you way from the most recent of my posts
toward the beginning. See if you can follow the logic, and present questions as you go.

I hope this helps

Good luck
 
Just add some thoughts on this:

"If you check the Internet listing for any top tier firm (try Goldman Sachs or JP Morgan
for example), you can find their trading results (trading only) for each year by
looking at the "10K SEC Summary Report". For each year, they show the number of
winning days vs losing days, and how much they make. The obvious question is 'How
do they do that"? AND the answer is that they do the opposite of what retail traders
do every day."

Having personally worked for a number of top tier banks, the statement is true in that they don't have many losing days, but that can be misleading. You see, a massive amount of their trading is NOT prop trading. Sure there is Market Making which can be considered 'prop' since they take a direction, but a large amount of trades are just client driven. A client of a top tier Firm asks for a particular trade, they are quoted a bid/ask, they take the trade, the desk goes to market and basically flattens it. They exit and take the small profit. Another client is speaking to the investment bankers about a takeover or perhaps they want some structured payments over a number of years...Investment Bankers need to ask the Structuring Desk to structure those payments, they need to go to maybe the FX Desk, the Equity Desk, each desk will take a piece of the pie and make money doing the transaction... so it will appear all desks are making lots of money. It is still Trading, because trades take place across the various desks, but it isn't the same game as what a retail trader is playing.

Consider an example, a colleague of mine was sitting at his desk (he worked on the Credit Derivatives Desk), a client of the bank calls and wants to buy a Credit Default Swap on some underlier, let's say ITRAXX (a lot of trading takes place on exchanges obviously, but still quite a large amount is OTC), he is quoted a bid/ask and decides to think about it. A different client calls a few minutes later, and wants to sell, he is quoted a slightly different bid/ask. One client buys, the other decides to sell, the trader facilitates that and makes several hundred thousand in the process. That took him about 30 minutes and was fortunate. This is client driven trade and is profitable and has very little to do with how we trade.

It isn't that they do the opposite of Retail traders and so they win, although that might be sensible, most of those trades aren't even the same game.

A lot of prop trading in banks died from 2008 crisis, but as I mentioned, of course market making is a form of prop trading. And they do still have 'some' prop trading. But it is much more preferable for them to just take the spread and commission and not have any directional risk. They can develop trading algorithms, but then market them to clients so the clients take the risk. It is a much more sure-fire way to make money, so that's what they do.

So yes, if a large portion of your 'trades' are client driven and you get to charge large fees and wide spreads and make the market yourself, and then unload that risk onto another market participant for pretty much risk-free money, then your trading results will look good most days.

However, just for argument's sake, if things were to be compared to a retail trader:
Banks have better systems
better market access
better research
better risk management
better data to back-test with
a lot more funds
highly educated employees
smart people with experience of trading
decades of experience developing ways to make money
maybe some other things I can't think of right now...

But it isn't all disaster... a retail trader can have some advantages. Unlike the market-maker you don't need to always be there offering a bid/ask, you can pick a direction. As a retail trader you can typically get in and out of any liquid market without having an effect and only some minor slippage perhaps. And a big factor... a lot of trades take place and aren't algorithmic trades with a heavily researched system that is proven profitable... a lot of trades are just business getting done.
 
You may want to review Adnan as I have added a comment to the above post
Hi Steven46,
I have already taken all these notes. Trader333 can remove this thread it he wants. And I already started studying and back-testing your method with my own option volume analysis method which I use in my trading. And I am already seeing great result. I believe it will definitely improve in my trading journey. And again thank you for your contribution which very few people do in this field.
 
Thanks Adnan for your kind words

You are doing something that we all should do, and that is
to test hypotheses to confirm that they are replicable

I will be staying around to post if time permits

Good luck
 
Posting an important chart and concept for those who continue to struggle

Retail traders often believe that all they need is an indicator, or a setup, and
that will give them the advantage they are looking for to make money. In reality
this (finding tools that work) is only a first step. Learning to use the tools is
the real challenge.

Today's "lesson" is about the necessity of learning to recognize identify the difference
between "trading range" and "trend" quickly, then applying the right strategy, even
if it is only to stand aside, and wait patiently for conditions to change

The attached is easy to read in hindsight (as all charts are). When the market is unfolding
however, and you (the trader) looking at only the first few bars or candles, it can be challenging

Definitions

Trading range behavior exists when the bars are side by side, or when there is significant overlap
of the bodies, AND the tails are prominent

In contrast, trending behavior is characterized by little or no overlap, (except at pullbacks) and tails
are relatively small

The chart also shows a type of price action called a "weak low/incomplete auction", in which the low
of each candle or bar ends at various prices. There is no single reversal. This indicates that institutions
want to stage (accumulate) volume at these prices, THEN at a later time, they will execute a "probe"
or "stop hunt" to activate resting orders below, before reversing in the other direction, transitioning
to a trend reversal.

In my experience, a substantial change from losing to winning days occurred when I learned to recognize
these conditions early on, then to stand aside, and wait patiently for price to trend. This for me was the
turning point in my trading experience.. I hope it helps some of you.
 

Attachments

  • TR to Trend Transition.PNG
    TR to Trend Transition.PNG
    135.9 KB · Views: 12
This chart shows the trades for London Session

I did not trade (Sleeping) but it was a gift to those
who used my system to obtain early identification of
the statistical skew (it was negative from the open)

Essentially, one could have got short anywhere and
held until a test (shown on the left hand chart (Daily Candles)
of what professionals call a "trend origin" candle
For those unfamiliar with the concept (that would be all
of you) the "Trend Origin" is always the 2nd candle from the
high or low. Automated programs run by institutions don't have
to sleep and so they monitor for "1st candles" that display
certain characteristics, When they "detect" a reversal they
bring in additional volume which serves as a "signal" to others
("we will be starting a move here"). It is also time based.
As mentioned, for those who know what to look for, it is a "gift"
In fact, some professionals actually call it an "early Christmas
present".

So in summary, four (4) trades, each one worth about +10

Good luck
 

Attachments

  • London Session 5-15.PNG
    London Session 5-15.PNG
    132.5 KB · Views: 13
This chart shows the trades for London Session

I did not trade (Sleeping) but it was a gift to those
who used my system to obtain early identification of
the statistical skew (it was negative from the open)

Essentially, one could have got short anywhere and
held until a test (shown on the left hand chart (Daily Candles)
of what professionals call a "trend origin" candle
For those unfamiliar with the concept (that would be all
of you) the "Trend Origin" is always the 2nd candle from the
high or low. Automated programs run by institutions don't have
to sleep and so they monitor for "1st candles" that display
certain characteristics, When they "detect" a reversal they
bring in additional volume which serves as a "signal" to others
("we will be starting a move here"). It is also time based.
As mentioned, for those who know what to look for, it is a "gift"
In fact, some professionals actually call it an "early Christmas
present".

So in summary, four (4) trades, each one worth about +10

Good luck
Hi Steven46,
What is your thought when you see very narrow +/- skewness? Do you trade on that time? How much skewness do you prefers? I noticed that NY market ranging today from 8:30 am - 11:00 am because of the narrow skewness.
 
Last edited:
Hello Adnan

When the skew is narrow, it indicates that the market is symmetrical, meaning that there is no significant tendency
for price to move higher or lower (for this time period). That of course will eventually change as new data (volume)
enters the market creating a breakout. At that point, skilled traders evaluate the breakout and the followup candle
and its affect on the skew. That is how a tradeable setup is formed.

Attaching a markedup chart to illustrate. As you can see, the space between the red line (VP/POC) and the VWAP
increases as more buyers enter the market. The breakout candle is considered strong, and so is the follow up
candles. That suggests that the odds favor continuation.
 

Attachments

  • Breakout on Developing Skew.PNG
    Breakout on Developing Skew.PNG
    138.6 KB · Views: 12
Last edited:
We attach an example of the Weekly Cycle Chart that we teach to our students
as the basis for developing a sustainable trading plan. There are many things
that can be learned from this model, among them (and most importantly) are
repeatable patterns, expectation for tradable ranges (how long traders should hold
positions), and WHEN the big institutions are likely to move markets (during which
session, and at what times). There are many other things that can be learned from
what we call "Structured Analysis". This chart is the basis for the preparation that
we engage in every weekend.

On top of this we overlay the schedule of Economic News Events, looking to gain
an advantage by planning (just as the top tier institutions do) how to trade the
anticipated impacts of these events.

The bottom line is that we were trained to do this by institutional traders, and we
use that training to our advantage. In contrast, most retail traders do NOT use this
approach, and do not have this training, and that in part is why, so many end up
losing (everything in their accounts).

Good Luck
 

Attachments

  • Weekly Trading Cycle Example.PNG
    Weekly Trading Cycle Example.PNG
    136 KB · Views: 11
Here on the West Coast US it is 10:30pm and from our
point of view, it is the start of a window within which we
(sometimes) look for trades, that can be held through the
London Session, AND if we have done a good job of
"Structured Analysis", it is often the case that this same
position can be held through the entire NY session as well
The odds of success for a trade like this (inside the circle)
are high (estimated at >75%). We generally find two (2)
to as many as four (4) or five (5) of these per week.

The process involves careful 1) Structured Analysis of the chart
2) Overlay and planning around Economic News releases, 3) Monitoring
and Identifying specific opportunities, and finally, 4) Executing the entry
and 5) Holding the position as long as it continues to "Work for us".

As with other elements of trading I provide, you won't find anyone else
talking about this, nor will they display the skill needed to make use of it

Good luck
 

Attachments

  • Structured Analysis Example.PNG
    Structured Analysis Example.PNG
    151.8 KB · Views: 10
Hello Traders

It is just after 5am on the West Coast USA

I did not trade the "overnight" market (London) however
it is my practice to always markup the chart regardless.

In the previous post, I commented on the skill required to
use the tools of the trade. This evening's market was a good
example. If one were to trade the London market using Skew
and VWAP AND they were trading with 5 min candles, they
might have hesitated to enter because the skew was (approximately)
symmetrical. IF however they had the requisite math background,
they might know that statistical analysis requires a "significant sample size"
and the London Session tends to be a low volume market. Thus the
reading (symmetrical skew) would be distorted. The solution
is to use 15 min candles to obtain the proper sample size. By doing
so you get a more accurate (and thus more tradable) signal.
The bottom line is that you get filled a little later, but at least you
have the opportunity to trade and make that profit.

Good luck
 

Attachments

  • London Session 5-16.PNG
    London Session 5-16.PNG
    121.5 KB · Views: 7
Back
Top