Hi F,
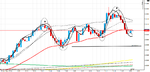
Would you mind at some point clarifying this with your chart, and ideas, because when I look at the EU I see confusion, with long term LRs being under price, but the medium ones, the traffic light on my chart, are all over price, which prevents me from taking a buy at any of the lows shown here.
thanks
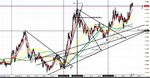
for me this is about mixing pa levels with lr turn signals
as i see it in hindsight and limiting lines to ones i would have been using at the time:
A)yellow circle shows retest of broken yellow trendline( a forgiving one at that)= bullish
B)pink rectangle.: price breaks through blue tl and tested pink horizontal support line, then breaking back above blue tl at 13:30= bullish but officially white rectangle fractal only becomes a higher low when price breaks above red rectangle fractal( this happens at 13.40 ish.
so three bullish signs, price is above yellow down trendline, failed to stay below blue trendline and left a gap above horizontal pink line support.
so price turns at green triangle. whats important is it failed to breach interim support at the unfilled green triangle. then the next low at the white arrow gives us a new trendline in white. we can also draw an intereim support line there.
then both these lines hold at eotw 14.09
in that whole 30 mins from abouut13:45, price actually forms a sort of triangle. we see a high, a higher low in green transparent box then lower high etc, so if we took the long at 1412 it would be with the caveat of breaking above light greeen triangle high and then red resistance box higher up, formed from older pa.
so lr wize, we see that you medium set came over and price tried to get lower. it went some, failed then continued with the session bias. in other words the lr did their job.
It might be interesting to look for another chart wiht similar medium term set up etc but with the longest set being in different position re price, and see how that narrative worked out.
from this description i reckon you could write as set of repeatable instructions/ questions about this process that would keep you actively questioning what you are seeing. When you can do this, you will begin to wonder why people use preset orders to enter positions when they are not using all that info that develops in the meantime... duck