You are using an out of date browser. It may not display this or other websites correctly.
You should upgrade or use an alternative browser.
You should upgrade or use an alternative browser.
90% get it wrong?
- Thread starter bisto
- Start date
- Watchers 15
- Messages
- 2,325
- Likes
- 17
timsk - in one word: indicators.
90% use 'em, and rely on them. The trouble is that they get you into a position late, and get you out of a position late. So you only get a fraction of what is actually on offer.
You have only to look at the vast majority of charts posted on websites, not just on T2W, to see that there are lots of indicators on those charts, all in nice bright colours, and the chart is lit up like a Christmas tree. Trouble is, you can't see the actual branches underneath for all the adornments and tinsel. The price bars are the branches, and with a lot of practice you'll realise that those price bars tell you more than perhaps 20 different indicators. It's all back to keeping it simple.
90% loose because..
-Entry level is easy
-Tools to trader are mostly not profitable, ie anything making money is usually a well kept secret
-Risk of overtrading via online trading tools
-Novices always underestimate the degree of difficultly required to be win over a peirod of time, not every one can do brian surgery
- Good trading mentors are 1 in 1000
- Low capital and bad money management
Thats why everyone fails, so 90% of the 90% who fail are plain STUPID !
To be perfectly honest i find it quite amazing that such a high %age lose, you would expect at a %age like that, that the market would run out of investors (private) quite quickly, and have a high turnover of (newbie) investors, whom lose out and then never return. Surely it has to be lower? Either that or would be investors play the stockmarket like they would the horses...Again something which i find difficult to believe.
90% loss rate has got to be wrong otherwise investors would invest in...well... anything other than the stockmarket (be it long or short)
90% loss rate has got to be wrong otherwise investors would invest in...well... anything other than the stockmarket (be it long or short)
kael
don't mix up investors and traders.
most investors tend to buy and hold.
its traders who have the difficulty of staying in the game and
consistently making money.
but using your philosophy, people would have given up betting
on horses , playing the wheel at the casino , buying lottery
tickets etc etc as they virtually all lose money.
But the gambling passion lurks at the bottom of every heart.
(and always will)
(Honore de Balzac)
timsk
Legendary member
- Messages
- 8,912
- Likes
- 3,629
Skim, (JonnyT)
I'm having trouble seeing the wood for the trees with your analogy! I follow your logic that if 90% of traders use indicators and fail, on the face of it, they would all be well advised to ditch 'em. (Or, it might suggest that the said 90% are not very good at using / interpreting indicators?) Sorry to be dim, but could you please clarify what you mean by 'indicators'. I assume you are referring to things like volume, RSI, CCI and MACD etc. as opposed to support / resistance, trendlines and chart patterns (i.e. T.A.)? My confusion is that the losing 90% will all use this latter group as well as the first group. If you are not using ANY of the above to trade, then I'm completely baffled as to how you trade at all - assuming you're not using Nasdaq Level 2 that is? Any clarification would be much appreciated.
Thanks, Tim.
Hi Tim,
Pure price action. If it's going up go long and visa - versa.
Indicators muddle things.
Of course you have to work out when to enter and when to get out!
For that reason I personally like 5 minute charts as I think smaller timeframes are too noisy.
JonnyT
Pure price action. If it's going up go long and visa - versa.
Indicators muddle things.
Of course you have to work out when to enter and when to get out!
For that reason I personally like 5 minute charts as I think smaller timeframes are too noisy.
JonnyT
CityTrader
Established member
- Messages
- 666
- Likes
- 26
There was a legendary Seinfeld episode where George realised every instinct he had was wong- and he started acting the opossite way to what he felt he should do, and everythign worked out brilliantly for him. The reason that 90% fail is "herd mentality" - 90% of the market is bullish at the top,- then, when there's no one left to buy it, of course it goes down. an old market adage " the market always looks the best at the top"
Wayno
Wayno
- Messages
- 2,325
- Likes
- 17
Don't get too hung up on my statement about the 90% - it was a figure of speech primarily.
I trade ES intraday, and there's no Level 2 on ES as it's an electronically traded emini future.
I use a 5 min chart, and a 10 minute chart. On those two charts I have price bars and volume bars. Every bar is the same colour. That's it.
I don't use any 'man-made indicators' such as RSI, CCI, MACD, bollinger bands, moving averages, ADX, etc. I just use the price bars themselves to indicate to me what is happening and what I would expect to happen.
This is an interesting thread, and I had this discussion before on another forum. I believe it is not so much what get's traders IN a trade that make them lose money, but their exit strategy and money management.
Look only at one small (but very important) aspect: The placement of stops. How many times has it happened that your stop gets hit, only to see the market return in the right direction again ? How many times for the same reason we are prone to premature "profittakingitis" in stead of letting profits run and go with the trend ?
Indicators, chart patterns etc. are the traders tools. Tools that work for one, in one market, might not work at all for somebody else. Or might not work in another market. You can have all the tools a carpenter needs, that still does not say you can make a table or a chair. There must be more to it.
It's only my opinion, but the most important factors in successful trading is money management and patience.
Have a good week, and good trades !
Andreas
- Messages
- 2,325
- Likes
- 17
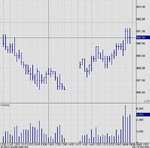
Here's what my 5 min ES chart looks like - this shows Friday afternoon's activity (15 August). As you will know the volume after the NY power cuts was abnormally low, and to cap it there was a break in the data feed on Lycos, hence the gap.
However, it was perfectly tradeable - note the double bottom, so you can enter at 987 with a stop below the first bottom, and ride it all the way up into the close. The double bottom was going to work well as there is lower peak volume on the 2nd bottom - a classic double bottom in fact. And as with any double bottom you would expect to have pullbacks all the way up, which is what in fact happened. There was a good 4 points on the table in that move, or 3 points if you are a more cautious trader.
I offer this just as a very simple example of how one can trade on price and volume only.
All it takes is a lot of practice to see these patterns, and of course you have to have the b*lls to go long when the price is going down, but that's the fun of trading. 😀
Attachments
timsk
Legendary member
- Messages
- 8,912
- Likes
- 3,629
Skim,
Thanks for the chart and explanation. If I remember correctly, earlier in the thread you said something to the effect that your trading turned a corner when you stopped using indicators that 90% of traders use. I am now very clear where you stand on 'man made' indicators - you don't use 'em! However, surely the 90% use classic chart patterns such as the double bottom in your example? This being the case, there is still an 'x' factor separating you, JonnyT and other successful traders from the 90% that lose. Perhaps it doesn't really matter whether one uses indicators, TA or a combination of both to enter trades. What matters, as Andreas suggests, is money management and a good exit strategy? Maybe it's these two that combine to form the elusive 'x' factor that is the key to successful trading?
Tim.
I would have to disagree with the assertation that indicators are a waste of time.
The key,like most things is to use them correctly,and understand their limitations.
I would agree that indiscriminate use of multiple indicators is unlikely to provide a trade that has any probability attached to it,as they will tend to confuse and blur the message.
The biggest mistake I believe for novice traders is the attempt to trade fast (short) timeframes.
They will invariably get chopped to pieces in 1/5/10 minute timeframe charts.
Start trading 120 mins charts,with a simple trend following indicator to indicate which side of the market you are attemting to trade.............and plot your support/resistance points in this larger timeframe,pivot points give reliable levels of intra-day support/resistance.........exercise some patience......stoploss dicipline.......you will become profitable quite quickly.
Overtrading is why many new traders blow-up,by waiting for high probability trades you will give yourself the time required to trade the markets with some understanding.
Trading 1 min. candles/volume will kill you fast unless you understand your timeframe,most new traders cannot hope to survive this killing zone.
cheers d998
I don't want to turn this into an indicator/no indicator thread...but personally I find some indicators give me a better visual clue than pure price/volume action.
No matter what you use, price/volume/MACD/RSI/Stoch's/CCI/horoscope at some point (or several) it is going to be wrong. The 10% of successful traders are the ones that mildly raise one eyebrow at this and hit the sell button. The other 90% of normal human creatures stare with disbelief and shout at the market for going the 'wrong' way and wait for it to come back again...which it does...a few months/years later. Then they stick a monster trade on to get all their losses back in one go, then they go back to their day jobs.
YMMV
Similar threads
- Replies
- 3
- Views
- 11K
- Replies
- 68
- Views
- 23K
- Article
- Replies
- 1
- Views
- 4K