You are using an out of date browser. It may not display this or other websites correctly.
You should upgrade or use an alternative browser.
You should upgrade or use an alternative browser.
'No indicators' revisited
- Thread starter ford
- Start date
- Watchers 53
clylbw
Well-known member
- Messages
- 454
- Likes
- 4
ford said:I dont disagree with your comments, to the contrary, I very much agree. However if days like yesterday, which appear to be a summer seasonal market thing continue, then I dont think it hurts to stand back and modify your trading strategy to cope with these changes.
These only need to be slight changes, for instance being able to identify the slow markets and tell yourself that it is infact slow and acknowledge it. Knowing the characteristics of the summer season market, the cyclical aspects of the markets when there will likely be money to be made (i.e. the morning, last 2 hours, news releases, whatever!), scratching trades faster than before (giving the market less time to move on your act of placing the trade) and so on.
A few pages back I posted about not trading when volume is below 4.5k contracts per 5 minute bar. This served well yesterday with one exception, the morning was choppy despite the volume consistantly above 4.5k. This is where I got cut up, so being able to avoid that in the future will be helpful")
Totally agreed.
I also feel that different, or at least revised, tactics may be required for the summer period, although the principles remain the same.
Like BBB says, there may be alternatives in other markets. Am researching this aspect.
clylbw
Well-known member
- Messages
- 454
- Likes
- 4
ford said:The amount of leeway you give it regarding the position of the stop depends on the momentum of the move I think. For instance today, the first impulse down was quite large that you could lock in decent profit while giving it enough room to run. Maybe Skimbleshanks can clarify, she might have a better method.
Thanks indeed.
F
ford
clylbw said:Thanks indeed.
:cheesy: I didn't see your post until I had posted mine but the reply would have been the same. Sandpiper put it best in a post a page or so back regarding stops and the trends potential. I'm just a hack in comparison.
clylbw said:Finally, there were actions today. BTW, Ford, I think you rightly said that Monday and Tuesday's actions were lull before the storm. :cheesy:
[ .. ]
Secondly, I wonder how would you set your target(s) if you had entered as I did, at the 14:00pm 5-minute bar? I must admit my technique is rather lacking in this aspect; I only used today's intraday low as the target. Certainly there are more sophisticated ways for setting targets?
Thanks indeed.
I got out of the idea of being a 'predictor', I think it's the wrong outlook to have. I'm now an observer and actor. Meaning, I don't know what the future holds, all I can do is observe what is happening and act on what the market does in the now. I spent too much energy wasting time drawing lines and projections and whatever on charts to see when the trend might end and where the charts may top out, only to keep going.
I look for the main points though, open, low, high, yesterdays high, low .. 3 day balance point .. but even if these points do end up to be the turning point in retrospect, the bar formations and volume usually tell me in the now. So I dont think you even need to be consciously aware of them.
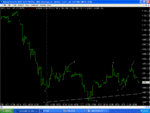
Just some observations and trades from 2day.
Possible trade on doji bar 1 closing one tick or so below last downswing suggesting swing up. It managed to reach high of the last pullback of yesterdays trading confirming resistance.
So, took safer trade of bar 2..failure to close higher and third knock on 1093. Exited and reversed on bar 3..end of 5 wave down and bounce of trendline support (am i allowed to mention trendlines on this thread??).
Exited on bar 4..three push up? Must admit, did cheat here as there was 2 peak rsi divergence on the Dow at the time.
Went long on bar 5 as it moved above open.. saw it as failed retest of open and closed on double top at bar 6. Could have/ should have reversed??
Never traded better than i have over the last week and its all down to price action. I'm glad i've ditched the indicators and back to trading how i originally did when i started. I feel now, more than ever, that i am starting to get a grip on wot to look for and trade. :cheesy:
Attachments
F
ford
SOCRATES
Veteren member
- Messages
- 4,966
- Likes
- 136
clylbw said:Finally, there were actions today. BTW, Ford, I think you rightly said that Monday and Tuesday's actions were lull before the storm. :cheesy:
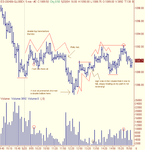
Back to today's NQ. After going short at the 14:00pm 5-minute bar, as highlighted by the blue line on the 5-minute chart, I trailed my stop along the trend. So towards the end of the 15:30pm 10-minute bar, I moved the stop at the top of that bar. Then the next 10-minute bar, indicated by the orange line in the 10-minute chart, ticked just above the previous bar's top to trigger my stop before collapsing into a new low. I wonder whether I had wrongly set the stop so I got stopped out just before the big move?
Secondly, I wonder how would you set your target(s) if you had entered as I did, at the 14:00pm 5-minute bar? I must admit my technique is rather lacking in this aspect; I only used today's intraday low as the target. Certainly there are more sophisticated ways for setting targets?
Thanks indeed.
The following may help you.
If you look at the period between 11 and 14, on 5-19 Wednesday, you will observe that after gapping up at the open at the 1425 level +or - 3 points there is not an adequate response for the price to go higher since the volume attributable to this period has collapsed from 10/~
down to 4/~and 3/~ or less.
This lack of Volume which represents lack of participation, shows lack of response to higher prices, causing the fall that commences at 1400 because the bar for this time is the 8th bar in the series to close in the middle or lower. This indicates weakness !
This weakness now provides the background for the price waterfall that now develops:~
The price waterfall gathers momentum because the volume increases. The clue is this volume does not reveal buying, or at least bears buying to close, because in this price waterfall an obvious propensity develops for bars to close in the middle or lower - the target low is quite obviously 1395 or perhaps even lower if momentum takes hold.
At 1395 there is a support level in place from the previous day. See how at 12 the previous day an attempt is made to take prices up ~ but again, there is little or no response, and so it settles back to the support level of 1395, to the close.
Therefore, the target clearly being 1395 or even lower, what you are not handling correctly is your stoploss management (which is too prudent, too tight for this scenario) and as a consequence of paying excessive attention to the stoploss trailer, you are not paying attention to the rate of price development.
You are single tasking instead of multitasking as this particular scenario demands.
Concentrating excessively on stoploss requirements is diverting your attention from the developing market action in its own right as a separate excercise, do you now understand this more clearly ?
The bars, as they form in real time, are telling you this is a weak market ~ but you are choking this message through your stoploss policy which is too tight There is not enough room allowed in your strategy to allow the price to breathe as it drops, also partly as a consequence of not paying sufficient attention in good time to weakness unresolved.
I say unresolved because the volume developing in the price waterfall is not excessive ~it is in the 10/~ range which is not substantial. Therefore as the volume is not substantial in comparison it is not going to stop the move whilst at the same time the trend is intact.
Therefore 1395 is still a valid target and remains attainable as subsequent events display.
That's all.
Last edited:
clylbw
Well-known member
- Messages
- 454
- Likes
- 4
Staged bottom (again) and exits in today's NQ?
Hi,
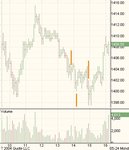
I wonder whether there was true staged bottom in today's NQ. I was getting concerned at the 13:50pm 5-minute bar, highlighted by the first orange line in the attached chart, as the volume seemed unusually high, pushing the price to close higher.
I covered my short at the 14:10pm 5-minute bar, highlighted by the second orange line. To me it looked like the end of the 5 waves from a DT; also, in terms of RR, I thought it unlikely to fall below the intraday low of 1399, but it could easily go back to 1404, so the RR seemed not right for further holding. However, the price fell to 1397.50, as indicated by the third orange line, before going back, and I fell uncomfortable for having missed the final part of the fall. Was there some mistake in my judgment?
Skim, if you are here, can you (or others) please tell me whether you would think the three 5-minute bars, indicated by the orange lines in the chart, as a staged bottom? They had approximately equal space between, 2 to 2.5 points, but the volume for the second bar was not substantial. In particular, how would you interpret the first bar with unusual volume?
SOCRATES, can you please tell me your opinion about today's fall between 11:35am to 14:55pm at apparently low volume?
Many thanks indeed.
Hi,
I wonder whether there was true staged bottom in today's NQ. I was getting concerned at the 13:50pm 5-minute bar, highlighted by the first orange line in the attached chart, as the volume seemed unusually high, pushing the price to close higher.
I covered my short at the 14:10pm 5-minute bar, highlighted by the second orange line. To me it looked like the end of the 5 waves from a DT; also, in terms of RR, I thought it unlikely to fall below the intraday low of 1399, but it could easily go back to 1404, so the RR seemed not right for further holding. However, the price fell to 1397.50, as indicated by the third orange line, before going back, and I fell uncomfortable for having missed the final part of the fall. Was there some mistake in my judgment?
Skim, if you are here, can you (or others) please tell me whether you would think the three 5-minute bars, indicated by the orange lines in the chart, as a staged bottom? They had approximately equal space between, 2 to 2.5 points, but the volume for the second bar was not substantial. In particular, how would you interpret the first bar with unusual volume?
SOCRATES, can you please tell me your opinion about today's fall between 11:35am to 14:55pm at apparently low volume?
Many thanks indeed.
Attachments
SOCRATES
Veteren member
- Messages
- 4,966
- Likes
- 136
clylbw said:Hi,
I wonder whether there was true staged bottom in today's NQ. I was getting concerned at the 13:50pm 5-minute bar, highlighted by the first orange line in the attached chart, as the volume seemed unusually high, pushing the price to close higher.
I covered my short at the 14:10pm 5-minute bar, highlighted by the second orange line. To me it looked like the end of the 5 waves from a DT; also, in terms of RR, I thought it unlikely to fall below the intraday low of 1399, but it could easily go back to 1404, so the RR seemed not right for further holding. However, the price fell to 1397.50, as indicated by the third orange line, before going back, and I fell uncomfortable for having missed the final part of the fall. Was there some mistake in my judgment?
Skim, if you are here, can you (or others) please tell me whether you would think the three 5-minute bars, indicated by the orange lines in the chart, as a staged bottom? They had approximately equal space between, 2 to 2.5 points, but the volume for the second bar was not substantial. In particular, how would you interpret the first bar with unusual volume?
SOCRATES, can you please tell me your opinion about today's fall between 11:35am to 14:55pm at apparently low volume?
Many thanks indeed.
Mechanical Explanation As Follows:~
The first clue to observe is that all the business that matters is practically completed by 1130 and certainly completed by midday. In the first downleg to 1399 the volume is regular, and the closings which are very important, you will observe carefully at the the middle or near bottoms of the bars. This indicates that this is contrived weakness because they abruptly come to a halt at 1030 precisely, the next bar is up. Notice that these two bars in combination are in effect a very well defined tweezer bottom, signifying the end of this controlled fall.
In the pushup that follows, you will observe that around 11, that is for a period of 15 mins, meaning the previous bar, the 11o'clock bar and the bar that follows, the volume increases.
This clumping is out of context with what the price is doing and would appear to be delayed declaration, but it is so cleverly contrived that it succeeds in sucking in the unwary to believe
that this could be the big one, not all the way to the moon, but at least to mountain top height.
It only serves to trap in last minute participants as weak holders, look carefully and you will see that the three bars at this top close on the middle or lower. The first of the three has the heaviest volumetric impulse applied to it because it is here that the stale bulls have been trapped as weak holders.
In the price cataract that unfolds the volume declines, this can only be because it is being allowed to drift downwards as a result supply overcoming demand just sufficiently to tilt it downwards in a meandering trail. The clue is that as it falls, the bears covering their shorts become more and more active as they can see the bottom coming, the target being 1399 or thereabouts.
The 1420 top at the end of short covering is steeper than the 1355 top. The 1355 top is steeper
than 1320 top. At 1455 the last remnants of what is available is finally soaked up quickly by smart buyers who understand what is going on and act immediately. The consequence of
this is that prices now begin to recover rapidly. The closings are on middle and tops now, a very different scenario to that which developed earlier in the day, and it continues to move up from there. The bottom of 1397 is touched twice. First at 1455 and then two bars later at 1505, forming a classic spaced tweezer bottom with enough volumetric impact on the first bar to turn the price round ~ see how the bars that follow from there have higher and higher closings, as the move up begins to gather momentum.
At 1600 this momentum loses its power and there is no follow through. This bar closes in the middle and the bar that follows it closes on the low on lower volume. The next bar is up, at 1408, the volume is not insignificant and this, considering there are locked in traders at high prices from the price action that was contrived that I describe earlier taking place between 1135 and 1145 could signify an unwillingness temporarily to go higher. And it is also the end of the day, so we can expect a trail off. That's it.
E and F via usual route please. Thanks.
Last edited:
SOCRATES
Veteren member
- Messages
- 4,966
- Likes
- 136
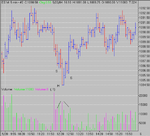
Price AND Volume
A quick question for all you dark-siders out there!
If we disregard the lovely price action signalling the long from 87.0 (which the author was too slovenly to capture), is the preceeding pattern of price and volume the "perfect" picture of an inverse head and shoulders?
The volume makes an almost mirror image in the form of an upright head and shoulders, where the head is the peak of volume which corresponds with the lower dip in price of the inverted head?
All contributions gratefully received!
Cheers
A quick question for all you dark-siders out there!
If we disregard the lovely price action signalling the long from 87.0 (which the author was too slovenly to capture
), is the preceeding pattern of price and volume the "perfect" picture of an inverse head and shoulders?The volume makes an almost mirror image in the form of an upright head and shoulders, where the head is the peak of volume which corresponds with the lower dip in price of the inverted head?
All contributions gratefully received!
Cheers
Attachments
SOCRATES
Veteren member
- Messages
- 4,966
- Likes
- 136
Quercus said:A quick question for all you dark-siders out there!
If we disregard the lovely price action signalling the long from 87.0 (which the author was too slovenly to capture
The volume makes an almost mirror image in the form of an upright head and shoulders, where the head is the peak of volume which corresponds with the lower dip in price of the inverted head?
All contributions gratefully received!
Cheers
No Quercus, this is not an inverted H + S, because the volumetric impact is in the wrong place.
But it is a very well defined tweezer bottom, with heavy volume on the first half of the tweezer, which is buying to close, the next bar is up on lower volume, and up it goes !
- Messages
- 2,325
- Likes
- 17
The chat room is far too distracting for me - I prefer the peace and serenity of just me, my charts, and the gentle snores of the dog under the desk.
Rognvald
Established member
- Messages
- 916
- Likes
- 15
Skim
does this ring any bells?
The Dog Rules
Dogs are never permitted in the house.
The dog stays outside in the specially built wooden compartment named for a very good reason, the dog house.
Ok, the dog can enter the house but only for short visits or if his own house is under renovation.
Ok, the dog can stay in the house on a permanent basis provided his doghouse could be sold in a garage sale to a rookie dog owner.
Inside the house, the dog is not allowed to run free and is confined to a comfortable, but secure cage.
Ok, the cage becomes part of a "two for one" deal in the garage sale and the dog can go wherever the hell he pleases.
The dog is never allowed on the furniture.
Ok, the dog can get up on the old furniture, but not the new furniture.
Ok, the dog can get up on the new furniture until it looks like the old furniture and then we'll sell the whole works, and buy new furniture on which the dog will most definitely not be allowed.
The dog never sleeps on the bed. Period.
Ok, the dog can sleep at the foot of the bed only.
Ok, the dog can sleep along side you, but he is not allowed under the covers.
Ok, the dog can sleep under the covers, but not with his head on your pillow.
Ok, the dog can sleep along side you, under the covers with his head on your pillow, but if he snores, he's got to leave the room.
Ok, the dog can sleep and snore and fart and have nightmares in your bed, but he's not to come in and sleep on the couch in the TV room, where you're now sleeping. That's just not fair.
The dog never gets listed on the census questionnaires as "primary resident" even if it's true.
Remember, in any and all house-hold interactions or disputes
-- the dog rules !
Firstly - thanks Socrates for another slant on the price action.
Secondly - you're making me sad Rognvald, as I'm missing my little girl who's gone somewhere warmer for winter! Lucky for her she has two homes, and has a controlling influence in both!
Q
Secondly - you're making me sad Rognvald, as I'm missing my little girl who's gone somewhere warmer for winter! Lucky for her she has two homes, and has a controlling influence in both!
Q
Similar threads
- Replies
- 0
- Views
- 2K
- Replies
- 1
- Views
- 5K
- Article
- Replies
- 2
- Views
- 11K
- Replies
- 0
- Views
- 7K