barjon
Legendary member
- Messages
- 10,752
- Likes
- 1,863
Well, here we are again - this time with number 4.
Two things first. It's been suggested that I archive these efforts into a single thread shorn of everything but the various analyses people have made and the final chart. If that finds favour I'll do just that in due course. Included a yes, no poll to gauge interest.
Secondly, I know that it's a bit much asking if there's a trade in view since most will want to see wot happens next via intraday movement or whatever. Nonetheless it is illuminating for people to say if they regard the point reached as a key point in trading terms and what they might do if the price does move one way or the other.
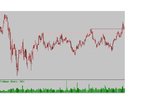
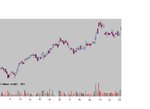
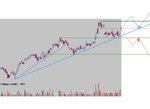
So, wot happened next working from the daily (first thumbnail) chart and is a trade in view - where would you be looking for entry, what target and what stop. A weekly chart is included (second thumbnail) for longer term information.
have fun
jon
Two things first. It's been suggested that I archive these efforts into a single thread shorn of everything but the various analyses people have made and the final chart. If that finds favour I'll do just that in due course. Included a yes, no poll to gauge interest.
Secondly, I know that it's a bit much asking if there's a trade in view since most will want to see wot happens next via intraday movement or whatever. Nonetheless it is illuminating for people to say if they regard the point reached as a key point in trading terms and what they might do if the price does move one way or the other.
So, wot happened next working from the daily (first thumbnail) chart and is a trade in view - where would you be looking for entry, what target and what stop. A weekly chart is included (second thumbnail) for longer term information.
have fun
jon