wot happened next? No: 4

to archive wot nexts into a single thread

  • yes

    Votes: 13 68.4%
  • no

    Votes: 6 31.6%

  • Total voters
    19

barjon

Legendary member
Messages
10,752
Likes
1,863
Well, here we are again - this time with number 4.

Two things first. It's been suggested that I archive these efforts into a single thread shorn of everything but the various analyses people have made and the final chart. If that finds favour I'll do just that in due course. Included a yes, no poll to gauge interest.

Secondly, I know that it's a bit much asking if there's a trade in view since most will want to see wot happens next via intraday movement or whatever. Nonetheless it is illuminating for people to say if they regard the point reached as a key point in trading terms and what they might do if the price does move one way or the other.

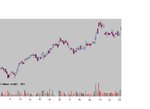
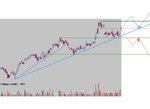
So, wot happened next working from the daily (first thumbnail) chart and is a trade in view - where would you be looking for entry, what target and what stop. A weekly chart is included (second thumbnail) for longer term information.

have fun

jon
 

Attachments

  • wot4.JPG
    wot4.JPG
    37.9 KB · Views: 547
  • wot4week.JPG
    wot4week.JPG
    55.7 KB · Views: 514
barjon said:
Well, here we are again - this time with number 4.

Two things first. It's been suggested that I archive these efforts into a single thread shorn of everything but the various analyses people have made and the final chart. If that finds favour I'll do just that in due course. Included a yes, no poll to gauge interest.

Secondly, I know that it's a bit much asking if there's a trade in view since most will want to see wot happens next via intraday movement or whatever. Nonetheless it is illuminating for people to say if they regard the point reached as a key point in trading terms and what they might do if the price does move one way or the other.

So, wot happened next working from the daily (first thumbnail) chart and is a trade in view - where would you be looking for entry, what target and what stop. A weekly chart is included (second thumbnail) for longer term information.

have fun

jon

Hi Jon,

If you were to keep this going, for even as little as six months, there would be 26 examples to consult, along with opinions, so I think that it is a good idea, especially if it is edited to the nitty gritty. That would mean that we could take the mickey out of each other for a short while, in the knowledge that you will come along and sort the posts out for posterity! Feel free to cut out parts of mine that are not relevant, not just the complete posts.

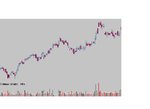
This problem has an awful lot of support underneath, going back several bars. I am interested in that it could have made a failed high, though. Taking into account that it it has gone to an overbought position in the last 17 bars and that it has retreated to close at half of the bar, I'd short this in the hope of being able to recoup my costs while waiting to see if it penetrates the support. I'd put my stop just above the high, 20 bars back or, if that is too far for risk, I'd get a bit closer with a 60 or 30 minute chart.

I'd be very interested to read others' analysis of their understanding of the volume part. What I don't understand , I don't use, but I live in hope that, one day, I will be able to get it. No target- just a "wait and see" policy and I would move my stop into breakeven as soon as practicable.

Regards

Split
 
Initially a short

barjon said:
Well, here we are again - this time with number 4.

Two things first. It's been suggested that I archive these efforts into a single thread shorn of everything but the various analyses people have made and the final chart. If that finds favour I'll do just that in due course. Included a yes, no poll to gauge interest.

Secondly, I know that it's a bit much asking if there's a trade in view since most will want to see wot happens next via intraday movement or whatever. Nonetheless it is illuminating for people to say if they regard the point reached as a key point in trading terms and what they might do if the price does move one way or the other.

So, wot happened next working from the daily (first thumbnail) chart and is a trade in view - where would you be looking for entry, what target and what stop. A weekly chart is included (second thumbnail) for longer term information.

have fun

jon
Jon

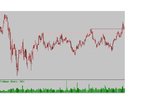
I would concur with Jon about shorting this initially, but longer term it will be going up. Here is my analysis:

Bars 81-85 Supply and demand pretty well balanced. Volume average or low. Resting period

86 – wide spread up, closing about 2/3 up on higher volume followed by

87-91 – trading sideways, resting period, not much professional interest shown by lack of volume, suggests that bar 86 was a test to see how much supply was available to dampen down the rally.

92-93 – confirmation that there is very little supply left.

95- distribution begins. Rising activity, large spread, closing near high. Looks positive for professionals.


96 – hugh volume, plenty of activity as those weak holders see a further chance to climb on board, that they missed on earlier rallies, but look at how there are already signs of weakness. The close is about mid-way, suggesting that professionals were selling early in the day.

97 – confirmation of this is shown in this bar showing narrower spread with close moving towards bottom of bar on lower volume.

98 – 99 – coming to the end of the distribution. Professionals are selling at the highs early in the day, but the close is near the low on hugh volume. There is definite weakness here as stock is transferred rapidly to weak holders.

100 – balance in supply and demand as weaker holders are hoping that the rally will resume, but it does not. This situation continues to 103. Note the low volume, professionals are not interested in supporting this.

104-105 Now a gap-down designed to lock weaker holders into their positions. They are not being given a chance to sell and they hold on hoping that the good days will return.

106 – 119 This stock seems to be characterised by these sideways drifts. Volume is pretty constant throughout as weaker holders are battling things out amongst themselves.

119 – weaker holders now need to be set up psychologically. Prices are too high for the professionals and there are a lot of weaker holders who bought near the high in the hope of the rally continuing, but they were locked in earlier and are nervous. Volume is increasing here but to what effect prices are pushed up during the day, but close near the low and below the open.

120 – this is repeated. Prices goes up, but close near the low, but this time above the open. Volume is still increasing

121 – final bar is up, but shows balance.


Now weak holders are going to be let down with a big bump. The next few bars will be down bars with wide spreads. I would be shorting at this point.


I think I would agree with Spit with a stop at around the height of bar 99


I would be looking to go long again within the area shown by the low of bars 38 to 74

PS: I voted to keep the threads separate at first, because it is easier to comment on each example within its own thread. I agree, however, that threads older than the current and previous example, would be better if edited and amalgamated. Thanks for all your work here.

Charlton
 

Attachments

  • barjon 4 jpeg.jpg
    barjon 4 jpeg.jpg
    40.7 KB · Views: 423
I'm not overly fond or great at TA but I would like to join in with the game....

The daily looks at first appearances to be shaping up to an Evening Star or Bearish Abandoned Baby pattern but I would suggest the white body of the penultimate candle is not large enough to justify this scenario.

Being deeply suspicious of anything that looks too bloomin obvious perhaps the next candle will be a fake bearish candle (maybe opening lower) drawing in the weak hands and eager profit takers before ascending to new highs as implied on the weekly.

Basically it's gonna go down for a bit then shoot up.
 
trappertom said:
Come back Mr Marcus! I know you've retired from the boards, but can we persuade you to come back once more? Show us numpties some Mr Marcus magic!

Speak for yourself mate!
 
Charlton said:
Trappertom

How about doing some TA and not calling the people on this thread Numpties

Charlton

Thank you Charlton.

Trappertom may do well to heed his own advice...

......otherwise there'll be no numpties left. :cheesy:

trappertom said:
It is incredibly sad that the atrocious conduct of just a handful of individuals has been allowed to shape the future character and usefulness of this site.

This is a serious issue for moderators to considerm as ultimately the future direction of the site is in their hands.

I cannot comment about the other good traders that have been decided to keep away from here due to the abuse they are are getting.......
.
 
Last edited:
No...very similar..."sounds like"....four letters...that's :LOL: all. ..also....prod..........(anagram)....:rolleyes:
 
Last edited:
And it is not Pluto....and it is not Uranus either......still plodding....with it.....got it yet ....or not ?
 
Jon,

Am I correct in assuming that the latest post has been removed? The effect has been removed but not the cause, which I don't think fair.

Split
 
Splitlink said:
Jon,

Am I correct in assuming that the latest post has been removed? The effect has been removed but not the cause, which I don't think fair.

Split

split

yes, by the poster himself

jon
 
Hello MM, I expect you are going to tell them about the island and after the island, and perhaps after the after the island....LOL....I am not as generous as you nowadays...I just give clues...but they do not land of course....LOL.

Kind Regards.
 
Hi Jon,
I haven't read the thread yet to help ensure that I'm not unduly influenced by what other people have posted. This means that I'll either repeat what others have said which will be boring - sorry! - or I'll say something very different and look very silly indeed. Oh well, in for a penny . . .

The modified chart attached pretty well speaks for itself. Price could meander around in a sideways congestion pattern for a while before taking the bullish or bearish routes shown. Of the two, I would put my money on the bullish outcome for the following reasons:
1. Price is in a clear uptrend, as evidenced by a succession of higher highs and higher lows, so my general inclination would be to go long.
2. The previous 15 days or so has seen price form a base with no attempt to break down. At no point have either the central green support line or the long term pale blue trend line been tested.
3. Price has broken not only out of the congestion pattern to the upside with a strong gap up, but it has also cleared the highest high of the recent base.
4. Since the start of the base, volume has been unremarkable – until the current candle and penultimate candle where it has picked up noticeably. Although neither candle is strong in itself, the net result is a clear move up in price.

In terms of a long entry, I would want to wait for confirmation of the points made above. If the trend were to remain in tact, I would look for price to roughly follow the dark blue line and move up to form a new higher high. The correction – when it comes – would find support in the area of the horizontal grey line which, more or less, demarcates the area between the top of the base and previous push to the chart all time high. Price currently sits slap bang on this line. I would go long on the breach of the high of the higher swing low, as indicated by the pale blue fill.

On the other hand . . . The current candle being a doji created on good volume suggests equilibrium between buyers and sellers. It could be that this will form a lower high and that price will drop, breaching both the trend line and support line, marking a change in trend. If this scenario were to pan out and price roughly follows the course of the red line down, I would look to go short on the breach of the low of the lower swing high, as indicated by the light red fill.
Tim.
 

Attachments

  • WOT 4.jpg
    WOT 4.jpg
    52.9 KB · Views: 301
timsk said:
Hi Jon,
I haven't read the thread yet to help ensure that I'm not unduly influenced by what other people have posted. This means that I'll either repeat what others have said which will be boring - sorry! - or I'll say something very different and look very silly indeed. Oh well, in for a penny . . .

The modified chart attached pretty well speaks for itself. Price could meander around in a sideways congestion pattern for a while before taking the bullish or bearish routes shown. Of the two, I would put my money on the bullish outcome for the following reasons:
1. Price is in a clear uptrend, as evidenced by a succession of higher highs and higher lows, so my general inclination would be to go long.
2. The previous 15 days or so has seen price form a base with no attempt to break down. At no point have either the central green support line or the long term pale blue trend line been tested.
3. Price has broken not only out of the congestion pattern to the upside with a strong gap up, but it has also cleared the highest high of the recent base.
4. Since the start of the base, volume has been unremarkable – until the current candle and penultimate candle where it has picked up noticeably. Although neither candle is strong in itself, the net result is a clear move up in price.

In terms of a long entry, I would want to wait for confirmation of the points made above. If the trend were to remain in tact, I would look for price to roughly follow the dark blue line and move up to form a new higher high. The correction – when it comes – would find support in the area of the horizontal grey line which, more or less, demarcates the area between the top of the base and previous push to the chart all time high. Price currently sits slap bang on this line. I would go long on the breach of the high of the higher swing low, as indicated by the pale blue fill.

On the other hand . . . The current candle being a doji created on good volume suggests equilibrium between buyers and sellers. It could be that this will form a lower high and that price will drop, breaching both the trend line and support line, marking a change in trend. If this scenario were to pan out and price roughly follows the course of the red line down, I would look to go short on the breach of the low of the lower swing high, as indicated by the light red fill.
Tim.

Your scenario shows, to me, the need for a trader to be able to stop quickly, if wrong, and go into a reverse trade.at once. This I have been telling myself that I should do for years, but I never do it. Once a trade is finished I leave the share alone., there is a psychological block preventing me from reversing it and I look for something else. I need a shrink :eek:

Split
 
trappertom said:
My word...I seem to have raised some hackles without intending to!

Those of us who've been helped by Mr Marcus were called numpties by him in an affectionate way - much of the time anyway!

No offence intended!

Have a good weekend.

OK. Accepted. One word of advice. If you're ever in Scotland, don't go calling anybody a numpty because we may not be able to put you back together again. :cheesy:

http://www.urbandictionary.com/define.php?term=numpty
 
Shrink Yourself.......

Splitlink said:
Your scenario shows, to me, the need for a trader to be able to stop quickly, if wrong, and go into a reverse trade.at once. This I have been telling myself that I should do for years, but I never do it. Once a trade is finished I leave the share alone., there is a psychological block preventing me from reversing it and I look for something else. I need a shrink :eek:

Split

Forget the shrink - they're all bonkers anyway..... :mad:

Try this. It works and it's free (for the first month)

http://www.infinn.com/subliminaldownload.html

Then program the following into the message window....

I am able to stop and reverse my trades with ease.
 
Splitlink said:
Your scenario shows, to me, the need for a trader to be able to stop quickly, if wrong, and go into a reverse trade.at once. This I have been telling myself that I should do for years, but I never do it. Once a trade is finished I leave the share alone., there is a psychological block preventing me from reversing it and I look for something else. I need a shrink :eek:
Split
Hi Split,
You do yourself an injustice, IMO. The week before last I took a swing trade on the FTSE 100, going short at 5836. The index made a low of 5658 last Tuesday 18/07/06 and I set a trailing stop just above the H.O.D at 5715. Wednesday 19/07/06 opened strongly and I was duly stopped out. At the time, I thought that I ought, really, to implement a stop-and-reverse order as a buy signal was given at the same time as my stop was hit. In retrospect, this would have proved to be profitable. At the time, however, I had made larger than expected gains on my short position and I was keen to 'enjoy the moment' for a little while longer and not put at risk any of my profits. So, the point of all this is: don't beat up on yourself too much, you're human, just like (most of) the rest of us on T2W! The need to pause and reflect after a trade before moving on to the next one is a sign of strength and maturity IMO and nothing to be ashamed of or embarrassed about.
Tim.
 
Hi Rols and Timsk,

I was taking the mickey out of myself, I'm not the type to analyse myself too much. In any case, at my age, I have left it a bit late!

I appreciate your interest, nevertheless..

Good trading

Split
 
Top