wot happened next? No: 3

barjon

Legendary member
Messages
10,752
Likes
1,863
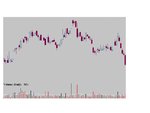
ok, something different this time.

Another one that has been rising for some time with the highs here representing all time highs.
I'll show more of the history in the next post for those uncomfortable with the single (daily) timeframe.

So without more ado, wot happened next and do you smell a trade coming on? If so with what entry and with what target and what stop?

Over to you

good trading

jon

edit: tried for a better chart - this cut and paste's a bind :devilish:
 

Attachments

  • wot3third.JPG
    wot3third.JPG
    43.6 KB · Views: 444
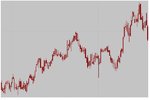
and the long term weekly:
 

Attachments

  • wot3week.JPG
    wot3week.JPG
    20.4 KB · Views: 370
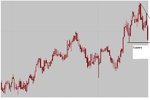
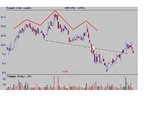
If it rallies upwards towards the down trendline, across the tops, I would short it, if I could see a signal there. I feel that the trend is down but it is in a bad position to enter a short trade now.

Sorry, I'm not too good manipulating Paint.

Split
 

Attachments

  • Wot3.JPG
    Wot3.JPG
    21.2 KB · Views: 338
Splitlink said:
If it rallies upwards towards the down trendline, across the tops, I would short it, if I could see a signal there. I feel that the trend is down but it is in a bad position to enter a short trade now.

Sorry, I'm not too good manipulating Paint.

Split

split

going for a long term trade with the weekly, eh - that's not like you :cheesy:

what about the daily (first chart) - that's more your scene.

good trading

jon
 
barjon said:
split

going for a long term trade with the weekly, eh - that's not like you :cheesy:

what about the daily (first chart) - that's more your scene.

good trading

jon

Trying to get me to part with my hard earned cash, eh?

With the daily, I don't see any difference. The support is in the same place and has been pierced by the latest bar. There's nothing that I can see to make me come to a decision, I'd have to wait for a few more bars, so. if short, I would hold. Otherwise, try for a 123 pattern with 1 as the latest low, perhaps. The main information that I would have (and which you are not giving out until the solution) is the distance from that trendline in points. Is it worth going for? Because I believe that around that trendline is where a short entry should be placed.

Another tool that I would be using is the hourly, or 30 min chart, to help me form an opinion on a reversal and get into a 123 pattern with a lower risk.

Regards Split
 
Splitlink said:
If it rallies upwards towards the down trendline, across the tops, I would short it, if I could see a signal there. I feel that the trend is down but it is in a bad position to enter a short trade now.

Sorry, I'm not too good manipulating Paint.

Split

I'm with you on this. I'd wait for a pullback and jump on a short.
 
Personally I do what the market dictates in clear moves rather than the if/or/when approach.
That means I would be looking here to see if a bounce opportunity sets up, if it does, fine; if not, no trade other than intra day scalps.
I need to see how the stock behaves intra day to closely define a set up. That is, enter on a micro level for the best entry into any trade, including swing trades.
Richard
 
It looks like a broken head-and-shoulders on both the daily and weekly.

There's more weight to downside volume.

I'm short already....

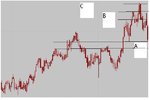
...with a target just above (bloody hell Jon, why not put in the price levels or at least some sort of vertical marker, A,B,C,D.....grrrrr), just above the higher leg (the first) of the most recent double-bottom on the weekly.

edit: stop would be just above right shoulder on daily.

It's tough to work R:R on vertical mms rather than price - looks like a 1:2 at best in which case I probably wouldn't be taking it anyway. And anyway, I wouldn't be trading these pack-horse UK donkeys anyway - and certainly not in these timeframes - and not this time of year - and not with all the jobs I've got to do around the place....
 
Last edited:
barjon aka 'candles'

Why do you not show the prices? In the real world we would see them and assess our risk/reward before taking the trade.

Regards

bracke
 
frugi said:
Cause then people might cheat. We must work in millimetres instead. :)

Surely not ! Are not the viewers of this thread above such petty points scoring?

How many millimetres to the penny?

Regards

bracke
 
In my paper account I would go short and once I had done that (knowing I am wrong 9/10) I would go long big time in my real account :cheesy:
 
My attempt at this

barjon said:
and the long term weekly:
Well Barjon

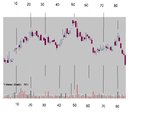
I'm going to stick my neck out and go the opposite way to most of the posters so far. I have numbered the bars in groups of 10 for easy reading and started my analysis about half-way through the daily.

Bar 48 Gap-up, wide spread, exceptionally high volume, close near high – professionals distributing to weak players

Bar 49 down bar, low volume – low demand, professionals distributing remainder

Bar 50 very low volume, doji candle, sentiment turning

Bar 51 down bar, wider spread, close at low, volume average, open at high and continues south – weak holders who had bought on the way up, starting to sell

Bar 52 wider spread still- suspect that the high was a ruse to shake out weak holders before price shot down and closed near low. All this on very high volume, as accumulation begins

Bar 53 upbar with narrow spread, balanced, moderate volume – a shakeout of supply remaining.

Bars 54 to 57 – generally decreasing prices and also volume as most of the supply dries up, Not much professional interest

Bar 58 – upbar with wide spread closing at high on average volume. An atempt to push price up, but professionals were not going to play, as evidenced by the following bars

Bars 59 to 61 – narrow spreads with very low volume. Accumulation is almost complete

Bars 62 and 63 – wider spread, closing near lows and a gap down. First bar on low volume and second on high. Shake-out and final stage of accumulation

Bar 64 – balance

Bars 65 to 76 – very sluggish. Narrow spreads and low volume inidcate that professionals still see weakness in the market, which is bourne out by the ambivalence of bars78 and 79

Bar 80 – higher volume and an attempt to push price up, but the volume is not as high as previous up-trends and price fails to remain at the high. Professionals are not supporting this. Trading activity is probably between weaker holders.

Remaining bars – prices drop further on average volume and more or less increasingly wider spreads as professionals succeed in removing the remaining supply that they observed at around bar 80.


The fact that the volume is not excessive at the right edge suggests to me that professionals see strength in this market and distribution is about to take place. I would expect another downbar or so into zone A on the weekly chart, perhaps down to the low of bar 3 or thereabouts, on fairly low volume.


This would be followed by a doji at low volume and an upbar closing at the high, also at low volume, at which point I would go long. This would be followed by a gradual and inexorable trend north on gradually increasing and controlled trading activity during a distribution phase.


I’m not confident enough to say exactly how far it will go, but I would be looking towards zone B, but would not be surprised if it continued up to C and beyond.

Charlton
 

Attachments

  • barjon3.JPG
    barjon3.JPG
    54.3 KB · Views: 221
  • barjon3w.JPG
    barjon3w.JPG
    23.5 KB · Views: 253
Well, I'm impressed - :D

i included this one as a reasonably straightforward head and shoulders with the final bar breaking the neck-line. The price moved up the next day to kiss the neck-line goodbye and there seems a good low risk entry as it retreated with a stop a few points above the neck-line.

The h&s target was just about achieved before charlton climbed aboard and enjoyed the steady march north.

good trading

jon
 

Attachments

  • wot3 result.JPG
    wot3 result.JPG
    64.7 KB · Views: 275
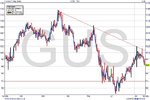
I did say that if I was short I would have remained so, which would have given me a useful profit so I'm taking 10 marks for that. It looks as if the horizontal marker on my chart would have been a good 123 pattern to open a long trade but I can't say that I would have taken that one (I must be honest :) and now it has touched the down trend line across the tops, which is where I would short- if I had the cash :cheesy: However, since I am elsewhere the decision does not arise. I like to chart the EOD close line on the chart, it helps me to see the 123 clearer.

Split
 

Attachments

  • GUS.JPG
    GUS.JPG
    85.3 KB · Views: 219
Top