You are using an out of date browser. It may not display this or other websites correctly.
You should upgrade or use an alternative browser.
You should upgrade or use an alternative browser.
I think that the real indicator of the current market top will be the SPX. It has moved ahead convincingly over the past week and is approaching a key resistance level around 1252. It has been the meat in the sandwich between the more laggardly Dow and the more bullish COMPX.
If the SPX continues its upward move to the next level of resistance at 1252 then we should see the Dow test 10800. The question then will be can the SPX breach this resistance. I think the odds are against this but there could be a period of consolidation between 1240 - 1250 before any move down commences. Once it does - watch out below - because we could see a very quick 500pt drop on the Dow
If the SPX continues its upward move to the next level of resistance at 1252 then we should see the Dow test 10800. The question then will be can the SPX breach this resistance. I think the odds are against this but there could be a period of consolidation between 1240 - 1250 before any move down commences. Once it does - watch out below - because we could see a very quick 500pt drop on the Dow
roguetrader
Senior member
- Messages
- 2,062
- Likes
- 49
Well a hard fought day with an hour and half in the middle that had about a 20 point range. But in the end the indices broke out and held. Both the Nasdaq and SPX set new multi-year highs again, and the INDU scraped above 10,700.
The big thing is that they managed a close above these levels, why is that so improtant? Because the buyers need a kick up the ass 'cause they won't buy, and what better incentive than to close the market just above resistance and the start the next day with a great big gap. Let those tight assed buyers think they've missed their chance, that the market is running away without them, recipe for a gap and go. To infinity and beyond.
Course on the other hand we could get bad data in the morning and gap down and drown. I think the opening will be very telling tomorrow.
roguetrader
Senior member
- Messages
- 2,062
- Likes
- 49
Racer, July is the seventh month, not sure where you are getting quarters and halves from, June was the end of the second quarter and first half of the year.Racer said:Yes, but what I meant was will there be added wave of buying because it is the start of the half year/quarter/month or whatever
roguetrader
Senior member
- Messages
- 2,062
- Likes
- 49
😆
frugi
1
- Messages
- 1,843
- Likes
- 133
Rare air?
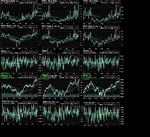
Negative divergences aplenty at the top of daily rising wedges, especially from our leading lady NDX.
Especially for roguetrader: a completed measured move on the SOX, I think. Taken with the Fib timing projection mentioned earlier I reckon she might be outta gas at last (?) 😉
I might buy some at the money Sep and Dec QQQQ puts tomorrow, ideally on a massive gap up. Mmmm puts 🙂
Attachments

roguetrader
Senior member
- Messages
- 2,062
- Likes
- 49
Some interesting stuff there Frugi.
User
Experienced member
- Messages
- 1,170
- Likes
- 23
The Dow hit 10700 wow......
No not really
A number of reasons why I think the Dow is done and dusted on the upside. (I won't mention all of them but here's some of them)
These reasons do not show up on the charts alone…….
I have listed a few of the main reasons below:
Reason 1
When the percentage of program volume executed for member firms initially spikes over 40%, it's historically been an indication of a longer-term turning point in the market. The reasoning is that firms often utilize program trades as a 'stabilizing force' to reign in excessive moves in the stock market (particularly on the downside), and this stabilization effort typically succeeds in reversing the current trend. If the spike occurs on a down week, it's been a longer-term bullish sign, while a spike on an up week has been a bearish sign.
The spike was on an up week which calls for lower prices ahead.
10 out of 11 winners (91%) since 1998
Reason 2
The 'Triple Play' strategy initiates a long or short position when institutional investors are positioned on the same side of the market (long or short) in all three of the major stock indexes. When institutions are long or short all three indices simultaneously, you rarely want to fight them by taking the other side of their trades. Instead, you want to piggyback on their positions and ride the market up (or down) until they they're no longer long (or short) all three indices. For a long-term timing strategy, the combination of a high return on investment and low drawdowns is tough to beat.
S&P500 will be trading higher when institutions are no longer long all three indices (for buys) or S&P500 will be trading lower when institutions are no longer short all three indices (for sells)
23 out of 29 winners (79%) since 1997
Reason 3
Institutional money moves the market. The backbone of successful long-term market timing is to follow the flow of institutional buying and selling pressure, which keeps one on the right side of the market - long the Nasdaq during low-risk periods and short during high-risk periods. One way to monitor institutional trading is through the breakdown of open interest in stock index futures, provided on a weekly basis by the Commodity Futures Trading Commission.
Nasdaq100 will be trading at a higher level when institutions turn short or a lower level when institutions turn long
28 out of 42 winners (67%) since 1996
Reason 4
The Commodity Futures Trading Commission breaks down open interest in stock index futures into various categories - commercial traders, large traders and small traders. So-called 'large traders' in stock index futures are typically on the wrong side of the trend, long during bear markets and short during bull markets, so you don't want to see large traders shift to the long side if you're bullish on the market. When we've seen such a shift in S&P futures, it's typically preceded a weak period for the S&P until this group moves back to the short side for three consecutive weeks.
Large traders in S&P futures are net long
S&P500 will be trading at a lower level when large traders shift back to the short side for three consecutive weeks.
7 out of 10 winners (75%) since 198
These are just some of the reasons.
A few more…..
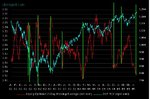
The Nasdaq Volatility Index (VXN) closed at a fresh 52-week low on Wednesday, and the VIX & VXO aren't far behind.
Persistently low volatility is one of the factors that has aided the market's rally of the past two years. Major sell offs are fuelled by volatility, and it's unlikely that we'll see a major market drop unless and until the VIX rises above 20. In the 1991-1996 period, the only other time in history that the VIX has held below 20 for such an extended period of time, the market experienced sell offs as large as 10%, but the VIX didn't break convincingly through the 20 level and the market soon resumed its upward trend. That's one potential scenario over the coming months, given that the VIX doesn't appear poised to trade convincingly over 20 for some time. In other words, we could see a significant correction in the neighbourhood of 10%, which would send the S&P down to test the year's lows around 1135.
Another reason…..
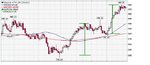
Last hour measures the price change in the final hour of each day's trading session and compares it to the price change in the first hour of trading. A positive number indicates the Dow's final hour outperformed the first hour, while a negative number indicates the final hour was weaker than the first hour. The indicator keeps a running summation of each day's final number and plots it on a cumulative basis in order to disply the underlying trend of last hour vs. first hour performance. When the last hour is consistently stronger than the first hour, shown by a consistently rising line on the chart, it's a sign of accumulation by 'smart money', while a falling line indicates 'distribution'.
We are seeing a good declining line……
I don’t want to start on the fundamentals, they are bad and only to get worse……!
I won't touch on the rest of the problems........one word though, 'oil'
Do you want abother word? Dollar.....Yes the dollar is looking good with this bounce on the long term downtrend. but the trend is about to resume........I have bought the Euro 12000-12040 and I have also bought the Swiss......
Commercial hedgers (smart money) have the lowest short positions in Swiss Franc futures for more then 6 years. Large speculators and small traders (dumb money) are heavily short and an end of the long downtrend of the Swiss Franc is likely. Act on it......
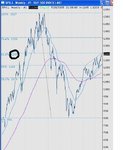
Charts…..
On the daily charts it seems to me like the next time the market breaks 10600.…..10575 for a definite confirmation…..upside will be over….
The size of the upmove is reaching limits........
I’m happy to get my shorts in at these fantastic levels…..If the market rises another 200 odd then ok…..I’ll short more……I say fantastic levels as it may well be the last time we see these prices over the next 2-5 years……I am long but its not staying with me for long........Maybe tomorrow and then that turns into cash.......Shorts are accumulating.....
Personally on the daily charts 10800 is my maximum tolerance level as we could touch this level as an extreme maximum…..possibly intraday or futures
The S&P is hitting highs and that’s good…….if you buy on the basis of that you will stuff up major time……
Don't chase the last few upward puffs as thats all it is....
This case is no different from the 2000 top……it could well be worse….!
Another reason…
If the market finishes out this week in the black, that will make five consecutive weeks that the S&P has rallied. Historically, five straight weeks to the upside is about all the market can put together before at least pausing, if not reversing the current up trend. Over the past two decades, there have been a total of 28 instances in which the S&P initially rallied five consecutive weeks. In only 8 cases did the S&P settle higher for a sixth week in a row... Since 1985...
One more reason for good luck…
A bearish seasonal pattern kicks in at Friday's close, further reinforcing the fact that while the market may chop its way sideways to higher in the days to come, buying pressure will likely be exhausted by the end of the week. That will set up a likely reversal to the downside during the first week of August…..
10000 is no problem......for sure we're seeing this level over the next few months.....9800 looks good......and even lower.....the levels we will hit will depend on the action - when it occurs.....
Do you want one more reason......ok then.....
When we're hitting highs or when we're moving higher or when the markets are bullish....just think of the feeling that we get......or the feeling that Bloomberg gives the markets.....
The guys that speak from the trading pits are the real b*****ds. These guys give opposite pictures from the actual stances they have on the markets and they portray a picture which is so good that they basically want your money in and their money out........
The feeling: Yes thats the one......
All the bears are sleeping
Its looking strong
We're moving higher
This is so solid crew
Selling is just not happening.....
and before you know it we're sitting 200points off......and then people are suggesting a buying opportunity and then we decline some more......and more and suddenly in a matter of days the tone changes drastically......
The market is bullish.....Yes......price is.....but the markets not......the market internals are not good.......I don't want to look at the market internals now as I think I've said my piece for tonight.....
I didn't want to go on for this long but it was requested so here you have it....
Sell :arrowd:
Oh and Good Luck
No not really
A number of reasons why I think the Dow is done and dusted on the upside. (I won't mention all of them but here's some of them)
These reasons do not show up on the charts alone…….
I have listed a few of the main reasons below:
Reason 1
When the percentage of program volume executed for member firms initially spikes over 40%, it's historically been an indication of a longer-term turning point in the market. The reasoning is that firms often utilize program trades as a 'stabilizing force' to reign in excessive moves in the stock market (particularly on the downside), and this stabilization effort typically succeeds in reversing the current trend. If the spike occurs on a down week, it's been a longer-term bullish sign, while a spike on an up week has been a bearish sign.
The spike was on an up week which calls for lower prices ahead.
10 out of 11 winners (91%) since 1998
Reason 2
The 'Triple Play' strategy initiates a long or short position when institutional investors are positioned on the same side of the market (long or short) in all three of the major stock indexes. When institutions are long or short all three indices simultaneously, you rarely want to fight them by taking the other side of their trades. Instead, you want to piggyback on their positions and ride the market up (or down) until they they're no longer long (or short) all three indices. For a long-term timing strategy, the combination of a high return on investment and low drawdowns is tough to beat.
S&P500 will be trading higher when institutions are no longer long all three indices (for buys) or S&P500 will be trading lower when institutions are no longer short all three indices (for sells)
23 out of 29 winners (79%) since 1997
Reason 3
Institutional money moves the market. The backbone of successful long-term market timing is to follow the flow of institutional buying and selling pressure, which keeps one on the right side of the market - long the Nasdaq during low-risk periods and short during high-risk periods. One way to monitor institutional trading is through the breakdown of open interest in stock index futures, provided on a weekly basis by the Commodity Futures Trading Commission.
Nasdaq100 will be trading at a higher level when institutions turn short or a lower level when institutions turn long
28 out of 42 winners (67%) since 1996
Reason 4
The Commodity Futures Trading Commission breaks down open interest in stock index futures into various categories - commercial traders, large traders and small traders. So-called 'large traders' in stock index futures are typically on the wrong side of the trend, long during bear markets and short during bull markets, so you don't want to see large traders shift to the long side if you're bullish on the market. When we've seen such a shift in S&P futures, it's typically preceded a weak period for the S&P until this group moves back to the short side for three consecutive weeks.
Large traders in S&P futures are net long
S&P500 will be trading at a lower level when large traders shift back to the short side for three consecutive weeks.
7 out of 10 winners (75%) since 198
These are just some of the reasons.
A few more…..
The Nasdaq Volatility Index (VXN) closed at a fresh 52-week low on Wednesday, and the VIX & VXO aren't far behind.
Persistently low volatility is one of the factors that has aided the market's rally of the past two years. Major sell offs are fuelled by volatility, and it's unlikely that we'll see a major market drop unless and until the VIX rises above 20. In the 1991-1996 period, the only other time in history that the VIX has held below 20 for such an extended period of time, the market experienced sell offs as large as 10%, but the VIX didn't break convincingly through the 20 level and the market soon resumed its upward trend. That's one potential scenario over the coming months, given that the VIX doesn't appear poised to trade convincingly over 20 for some time. In other words, we could see a significant correction in the neighbourhood of 10%, which would send the S&P down to test the year's lows around 1135.
Another reason…..
Last hour measures the price change in the final hour of each day's trading session and compares it to the price change in the first hour of trading. A positive number indicates the Dow's final hour outperformed the first hour, while a negative number indicates the final hour was weaker than the first hour. The indicator keeps a running summation of each day's final number and plots it on a cumulative basis in order to disply the underlying trend of last hour vs. first hour performance. When the last hour is consistently stronger than the first hour, shown by a consistently rising line on the chart, it's a sign of accumulation by 'smart money', while a falling line indicates 'distribution'.
We are seeing a good declining line……
I don’t want to start on the fundamentals, they are bad and only to get worse……!
I won't touch on the rest of the problems........one word though, 'oil'
Do you want abother word? Dollar.....Yes the dollar is looking good with this bounce on the long term downtrend. but the trend is about to resume........I have bought the Euro 12000-12040 and I have also bought the Swiss......
Commercial hedgers (smart money) have the lowest short positions in Swiss Franc futures for more then 6 years. Large speculators and small traders (dumb money) are heavily short and an end of the long downtrend of the Swiss Franc is likely. Act on it......
Charts…..
On the daily charts it seems to me like the next time the market breaks 10600.…..10575 for a definite confirmation…..upside will be over….
The size of the upmove is reaching limits........
I’m happy to get my shorts in at these fantastic levels…..If the market rises another 200 odd then ok…..I’ll short more……I say fantastic levels as it may well be the last time we see these prices over the next 2-5 years……I am long but its not staying with me for long........Maybe tomorrow and then that turns into cash.......Shorts are accumulating.....
Personally on the daily charts 10800 is my maximum tolerance level as we could touch this level as an extreme maximum…..possibly intraday or futures
The S&P is hitting highs and that’s good…….if you buy on the basis of that you will stuff up major time……
Don't chase the last few upward puffs as thats all it is....
This case is no different from the 2000 top……it could well be worse….!
Another reason…
If the market finishes out this week in the black, that will make five consecutive weeks that the S&P has rallied. Historically, five straight weeks to the upside is about all the market can put together before at least pausing, if not reversing the current up trend. Over the past two decades, there have been a total of 28 instances in which the S&P initially rallied five consecutive weeks. In only 8 cases did the S&P settle higher for a sixth week in a row... Since 1985...
One more reason for good luck…
A bearish seasonal pattern kicks in at Friday's close, further reinforcing the fact that while the market may chop its way sideways to higher in the days to come, buying pressure will likely be exhausted by the end of the week. That will set up a likely reversal to the downside during the first week of August…..
10000 is no problem......for sure we're seeing this level over the next few months.....9800 looks good......and even lower.....the levels we will hit will depend on the action - when it occurs.....
Do you want one more reason......ok then.....
When we're hitting highs or when we're moving higher or when the markets are bullish....just think of the feeling that we get......or the feeling that Bloomberg gives the markets.....
The guys that speak from the trading pits are the real b*****ds. These guys give opposite pictures from the actual stances they have on the markets and they portray a picture which is so good that they basically want your money in and their money out........
The feeling: Yes thats the one......
All the bears are sleeping
Its looking strong
We're moving higher
This is so solid crew
Selling is just not happening.....
and before you know it we're sitting 200points off......and then people are suggesting a buying opportunity and then we decline some more......and more and suddenly in a matter of days the tone changes drastically......
The market is bullish.....Yes......price is.....but the markets not......the market internals are not good.......I don't want to look at the market internals now as I think I've said my piece for tonight.....
I didn't want to go on for this long but it was requested so here you have it....
Sell :arrowd:
Oh and Good Luck
Last edited:
frugi
1
- Messages
- 1,843
- Likes
- 133
Reason 11: Confirmation bias :cheesy:
Sorry... 😱
Good post user. I'm with you, for similar and different reasons. The wall of worry can only be so tall, although, despite the decreasing quality of the mortar, it often grows taller than we imagine it might. When buying puts / shorting seems like a really bad idea, that's the time to do it. Nearly there imho. 🙂
Cheers roguetrader btw - always a pleasure to share perspective as it were. 🙂
USER
I am going to take the opposite stance, that is moderately bullish, and for the following reasons;
1.....Bond Yields are still too low, by comparison with 11 industries,these are just a brief selection, but indicitive of moderate valuations over defensive sectors
Chemicals..........................................2.7%
Savings & Loans...............................2.5%
Drug Majors.......................................2.7%
Utilities................................................3.5%
Electric................................................3.5%
Money Centres..................................3.7%
Tobacco..............................................4.8%
Conglomerates.................................2.1%
Food....................................................3.7%
Telecoms...........................................4.5%
Average...............................................3.38%
10yr Bond...........................................4.1%
Dividend / Bond.................................0.81
So, while not a screaming buy, there is still quite easily enough industrial areas that are still moderate value. Until the ratio drops below 0.66, dividends represent better value.
Inflation
While also a negative for stocks, inflation hurts Bonds far worse. With inflation creeping up, and oil particularly inflationary at the moment, Bonds are definitely not the place to be currently.
Earnings
Currently approximately 70% of stocks have reported stronger earnings than expected, thus a little more upside for stocks as a comparative to bonds, that currently have no upside, only downside.
Balance Sheets
Are probably the strongest they have been for 10yrs+
Currently cash positions are very strong in many companies, and this will stimulate investment, that will offset the inflationary drag on earnings into next year or two.
Dollar
The weaker dollar will stimulate export revenue, and those that are global will be earning in foreign currency, and with the change in the tax code, allowing offshore profits to be brought home, at marginal tax rates, a further boost to the balance sheets.
Overall, quite bullish for stocks. I believe the bears will be mauled quite badly if they hang onto their positions...................however, time will tell.
cheers d998
The bulls have the run of Wall Street; Dow up 68
Buying accelerates as earnings and stronger economy make investors happy. Whole Foods shares soar in after-hours. DaimlerChrysler jumps 10% with Schrempp quitting. Exxon's numbers are huge.
There was a fair amount of talk today about tomorrow's Gross Domestic Product report, and all that talk -- combined with mostly strong earnings -- helped produce a nifty rally in the afternoon.
The Dow Jones industrials finished up more than 68 points, and the Standard & Poor's 500 and Nasdaq Composite indexes both set new four-year highs.
The question on GDP is how good the growth both for the second quarter and the rest of the year? The consensus among economists is that the economy grew about 3.5% in the second quarter, down slightly from a 3.8% growth rate in the first quarter. It may actually come in a little less than that, but the pieces seem to be in place for a very strong economy for the rest of 2005.
The catalyst is good growth in corporate profits and, especially, in free corporate cash flow, David Sowerby from Loomis Sayles said on CNBC's "Closing Bell." Add to that strong consumer spending, good retail sales and the uptick in auto sales thanks to heavy discounting by the big automakers.
Add to that virtually no reaction to crude oil briefly topping $60 a barrel today, and the fact that interest rates were lower. The Commerce Department will release the report at about 8:30 a.m. ET tomorrow.
Translating the projections into stocks, Thomson Financial's Mike Thompson sees corporate earnings growth at 11% for the second quarter over a year ago. The third quarter he guesses will produce 18% year-over-year growth. A good, strong year by any measure.
Where's the job growth?
One question Market Dispatches will raise that sometimes makes the market mavens nervous: Will the market gains and the growth in profits also set off more corporate hiring?
The conventional wisdom suggests it will. So far, however, the evidence suggests hiring has not been expanding. "In no other post-World War II business cycle has employment growth been so weak," wrote Philippa Dunne and Doug Henwood of the Liscio Report this week. The report is a newsletter that tracks economic data generated by state and federal agencies.
The weakness is affecting affluent and less-affluent workers alike, and it is compounded by companies having to cope with rising health care costs, Dunne and Henwood wrote. That makes employers reluctant to do more hiring.
Whole Foods shares jump 10%
To continue with today's theme of bulls run crazy, shares of Whole Foods (WFMI, news, msgs) jumped more than 11% in after-hours trading after the natural and organic foods chain reported a 25% in third-quarter earnings. The stock gain to $136 came after a 2.6% increase in regular trading.
The Austin, Texas-based chain said it earned 60 cents a share in the quarter on a 23% gain in revenue to $1.1 billion. A year ago, the company earned 48 cents, and analysts were expecting 57 cents. Same-store sales were up 13.2%.
The company also raised its fourth-quarter guidance slightly and guidance for same-store sales to 9% to 11%, also up slightly. The company had 170 stores at the end of the quarter and plans to open five more this year. It did warn that earnings will decline by $10 million to $15 million to account for vested stock options.
The stock is up more than 42% so far in 2005.
'Buying is begetting more buying'
Today's rally did something the gains of the past few weeks have not. It forced a number of investors to buy.
"Buying is begetting buying," said CNBC's Bob Pisani from the floor of the New York Stock Exchange. NYSE volume looked like it would top 1.5 billion shares this afternoon. Volume above 1.5 billion shares on any day in July is "tremendous," Pisani said on "Closing Bell."
More than 300 stocks hit new highs today. The Standard & Poor's Mid-Cap Index ($MID.X), Russell 2000 Index ($RUT.X) and the New York Stock Exchange ($NYA.X) all hit new highs.
Needless to say, July has turned into a pretty fair month overall with a broad swath of the stock market showing gains. The Nasdaq is up nearly 7%; the Dow and S&P 500 are up more than 4% each. Check the diversity of the top 10 performers of the 42 indexes Market Dispatches tracks:
Daimler's Schrempp to quit; stock up 9%-plus
How much did DaimlerChrysler (DCX, news, msgs) investors want a new CEO? A lot. A whole lot. In fact, Schrempp's announcement he will leave the big automaker pushed the stock up 9.76% today.
Dieter Zetsche, who revitalized the Chrysler unit of the company, will take the reins of the automaker. Thomas LaSorda, not the former manager of the Los Angeles Dodgers, will take over as Chrysler's chief operating officer.
Investors have criticized Schrempp because the company's stock price has lagged since the "merger of equals" in 1998; the deal was sold to investors as a marriage of American and German icons, each of which would retain its soul. But top management at Chrysler was replaced with Mercedes talent, and today just one of the 10 supervisory board members is an American.
In a 2000 interview with the Financial Times, Schrempp said his plan all along was to “take over” Chrysler, making it a division of Mercedes, though he had not wanted to say so publicly to avoid creating an uproar by Chrysler workers. That brought a lawsuit from billionaire investor Kirk Kerkorian, accusing Schrempp and the company of fraudulently hiding their true intent. Kerkorian lost earlier this year.
But it’s not just billionaires and analysts who objected to Schrempp. He was heckled relentlessly at an April shareholders meeting. One shareholder noted that at the time of the merger, stockholders were promised a company with Chrysler's efficiency and Mercedes-Benz quality. What shareholders got was a company with Chrysler's quality and Mercedes-Benz efficiency, he noted pointedly.
"This is the day I've been waiting for," J.P. Morgan auto analyst Philippe Houchois told Reuters. "It's a wonderful day for the auto industry as a whole."
Under Zetsche, the company will likely focus on cutting costs in the Mercedes Benz operations since Chrysler is back on track, CNBC's Phil LeBeau reported.
Exxon nets more than $7.6 billion
High oil prices are kind to Exxon Mobil (XOM, news, msgs). The world's top oil company reported second-quarter net income of $7.64 billion, up from $5.79 billion in the same quarter a year ago.
And, as the day wore on, investors liked Exxon's performance more and more.
The stock was down in the mid-morning but closed up 0.67% at a nice even $60.
Excluding a charge, Exxon Mobil earned $1.23 per share, a penny above the Reuters Estimates consensus. Revenue rose more than 25% from the year-ago period to a staggering $88.57 billion, roughly the equivalent of the annual revenues for Coca-Cola (KO, news, msgs), Merck (MRK, news, msgs), Astra-Zeneca (AZN, news, msgs) and Comcast (CMCSA, news, msgs) COMBINED.
To linger on the sheer gaudy size of Exxon's net income for the quarter, let us note that it is roughly the same size as the annual revenue for ((Amazon.com, AMZN)).
"The real story here is what the long-term trend has been," Robert Kessler, an analyst at Simmons & Co., told CNBC's "Squawk Box." "Just in the last couple of month's Exxon Mobil's estimates for the quarter have risen 10%. You look back just a year ago and people though $3.50 a share for 2005 would have been rich, now we're toying with the idea of $5 per share."
The reason analysts keep underestimating Exxon Mobil's performance is "Wall Street's inability to predict oil prices,' he added.
XMSR ups subscriber forecast
XM Satellite Radio (XMSR, news, msgs) reported a second-quarter loss of 70 cents per share, a penny wider than the Reuters Estimates consensus. But the company boosted its 2005 subscriber guidance to 6 million by the end of the year from 5.5 million. Shares were up 0.22% on the day.
In other earnings reports:
Bristol-Myers (BMY, news, msgs) earned 47 cents per share, excluding items, in the second quarter, well ahead of the 36 cents per share analysts polled by Reuters Estimates predicted. The stock rose 0.3%.
Northrop Grumman (NOC, news, msgs) reported a profit of $1 per share in the second quarter, 12 cents ahead of the Reuters Estimates consensus. The company naturally boosted guidance for 2005. Shares fell nearly 1% today.
Dow Chemical (DOW, news, msgs) said it earned $1.20 per share in the second quarter, 2 cents lower than the Reuters Estimates consensus. The chemical company said price trends have become favorable moving into the third quarter, Briefing.com reported. Shares rose 1.7%.
-- Kim Khan and Charley Blaine
Great post User but one thing that I'm slightly confused about. Low volatility on the VIX is usually a bearish indicator and you state that "it's unlikely that we'll see a major market drop unless and until the VIX rises above 20".user said:The Dow hit 10700 wow......
No not really
A number of reasons why I think the Dow is done and dusted on the upside. (I won't mention all of them but here's some of them)
These are just some of the reasons.
A few more…..
The Nasdaq Volatility Index (VXN) closed at a fresh 52-week low on Wednesday, and the VIX & VXO aren't far behind.
Persistently low volatility is one of the factors that has aided the market's rally of the past two years. Major sell offs are fuelled by volatility, and it's unlikely that we'll see a major market drop unless and until the VIX rises above 20. In the 1991-1996 period, the only other time in history that the VIX has held below 20 for such an extended period of time, the market experienced sell offs as large as 10%, but the VIX didn't break convincingly through the 20 level and the market soon resumed its upward trend. That's one potential scenario over the coming months, given that the VIX doesn't appear poised to trade convincingly over 20 for some time. In other words, we could see a significant correction in the neighbourhood of 10%, which would send the S&P down to test the year's lows around 1135.
Sell :arrowd:
Oh and Good Luck
You then quote 91 - 96 when the VIX held below 20 for a sustained period of time and the market sold off by 10% but then recovered an upward trend. You don't see the VIX as likely to trade above 20 for some time, therefore are you expecting a sharp drop to be followed by a resumption in the upward trend this time around too ?
roguetrader
Senior member
- Messages
- 2,062
- Likes
- 49
The low VIX in itself is not the cause of major sell-offs, but a warning of excessive complacency that often leads to such a sell-off. This is one reason why the VIX is able to remain so low for so long. What marks a major sell-off is the excessively low VIX, followed by selling with a sudden rise in the VIX, and a subsequent continuing rise. Remeber the VIX demonstrates complacency, and a lack of fear, this does not drive sell-offs but forewarns of them.kriesau said:Great post User but one thing that I'm slightly confused about. Low volatility on the VIX is usually a bearish indicator and you state that "it's unlikely that we'll see a major market drop unless and until the VIX rises above 20".
You then quote 91 - 96 when the VIX held below 20 for a sustained period of time and the market sold off by 10% but then recovered an upward trend. You don't see the VIX as likely to trade above 20 for some time, therefore are you expecting a sharp drop to be followed by a resumption in the upward trend this time around too ?
Great post User.
I've researched the VIX, and one key thing I've learnt is that it must be treated as a "relative indicator". Absolute numbers are not the key. For short term reversals the VIX must be trading more than 10% away from its 10 day simple MA. Not there yet. For longer term "big trend" reversals the VIX needs to be above 118 % or below 80% of its 200 day simple MA. We're close, VIX 10.52, 200SMA 13.05 =80.6%
One Caveat though, the market can stay overbought/oversold for ages, ignoring the VIX number.
I've also read that the workings/machinations of the PPT are distorting the VIX readings making it less useful!
regards, G McA
gmca686 said:I've also read that the workings/machinations of the PPT are distorting the VIX readings making it less useful!
Temporary Open Market Operations (TOMO) from the Fed and Term Investment Options (TIO) from the Treasury ? The numbers quoted do not seem sufficiently large to effect the market direction unless they are used in some leveraged play. Outstanding TOMO is currently $35.25b. Yesterday, for example, the net add from the Fed was $4.5b and from the Treasury was $4.43b. Maturity is a maximum of two weeks for this money, at which point it will be rolled over at another auction, or it will come out of the market.
I have read that a low reading on the VIX can be indicative of high liquidity - is this the case ? If so, IMO, it is important to know the source of that liquidity. Institutional investment makes a sustainable market, government security auctions pumping the market is nothing more than a ponzi scheme.
Essay for anyone interested in this subject.
roguetrader
Senior member
- Messages
- 2,062
- Likes
- 49
Two interesting posts from Ducati (5937) and User (5935), both put a plausible case for their relative positions. I'd love to throw a lot of interesting facts in to support or dismiss one or the other, but I'm afraid I don't have any. Long term trading is really not my bag.
As a trader I see no advantage in calling major tops, or bottoms, my job is simply to be positioned on the right side of the market at the appropriate times, the magnitude of the move is of no real importance to me, excepting of course that it is of sufficient magnitude to make a profit.
Looking at the current market position, the ingredient I see as absent for a major top, is buying. Oh yes, there is very little fear, lots of bullish sentiment, and buckets of complacency, a dangerous combination, but very little buying. That suggests to me that there are a lot of participants second guessing the market here. The talk is bullish, but the walk is something else.
"Investors put a net $24.8 billion into domestic funds in the first half of the year, compared with the nearly $82 billion they invested in the portfolios in the first half of 2004," according to a report Thursday from the Investment Company Institute.
"Still, even as Wall Street has rallied sharply since late April, inflows into U.S. stock funds have remained depressed. In June the funds took in a net $1.7 billion, down from $5.2 billion in May," said the institute, the industry's chief trade group.
Does that smack of "walking the walk"? Is this the activity you expect at a major top?
Maybe it is, as I said before long term is not my bag and analysing this time-frame is a work in progress for me.
So where do | think we are?
Well I believe we are near a range top. I believe it is an expanding range and we have a significant downside move ahead into year end, to expand our current range below 10,000. the missing buying will seek to hi-jack the market at lower prices. I do believe that ultimately we will trade well below 10,000, the mid 7000's look good for a start, but that is a little way off..
Of course the longer your time-frame the more you are exposed to, as yet unknown economic and geo-political events, which could change that picture. How the housing "bubble" plays out for instance.
But right here right now, with the information at hand, that's what I see.
Similar threads
- Replies
- 1
- Views
- 4K
- Replies
- 1
- Views
- 5K