JillyB
Established member
- Messages
- 791
- Likes
- 38
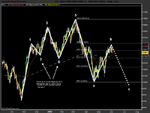
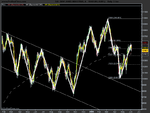
kriesau said:Actually the current consolidation range over the last 2 weeks is more like 200pts, with support at 10400/420 and resistance at 10580/600.
I'm also bearish, particularly with the trade deficit/budget deficit figures due out on Friday but we could first see a move up during the early part of the week before it makes a downward break through support at 10400.
Perhaps, but I wouldn't be looking for it to go down as far as 10420 at the moment. The low of 20th May at 10423 hasn't been repeated since. 10426 on 25th May was the next lowest, with 10448 on Friday.
This was what made me play safe with my trade on Friday and put my order to close the trade at 10450. I would still say that a safe consolidation range for trading purposes is only down as far as 10450.
If you take the highs and lows of the past two weeks then there is a slight upward bias to this consolidation, with it making slightly higher highs and higher lows.
This is another reason why I'm not bearish on the Dow just yet. Until I see a close below 10400, I won't be convinced that this is the way its going.
As far as the trade defecit/budget figures on Friday - take a look at last Wednesday and see what happened to the index when all the news that day was bad. It went up - basically because the bad news wasn't as bad as everyone thought it was going to be, so who knows. 😱