Hi DaveJB, as you will see from this post made last weekend, I have not been particularly bearish on the market.
http://www.trade2win.com/boards/showpost.php?p=181679&postcount=4377
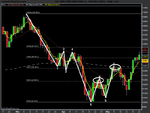
However, what has to be noted is that the INDU has shown the most relative weakness of the major indices, both the SPX and the COMPQ have pushed above their April highs, while INDU has been rangebound. INDU is bullish imho not by abundance of buyers, but by a lack of sellers, this is evidenced by its failure to break out of the range. My belief is the lack of sellers is due to the strength exhibited by the COMPQ during the past month, effectively scaring them off.
If, as I described in this post.
http://www.trade2win.com/boards/showpost.php?p=180841&postcount=4297
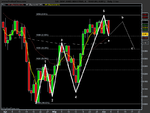
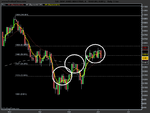
the bearish candle printed on the COMPQ yesterday leads to the correction I have expected then I see a COMPQ target of 2018, this may be all the re-assurance sellers need to enter the INDU, for that reason I would not be surprised if the next move on the INDU is down.