You are using an out of date browser. It may not display this or other websites correctly.
You should upgrade or use an alternative browser.
You should upgrade or use an alternative browser.
User
Experienced member
- Messages
- 1,170
- Likes
- 23
Should be interesting to see what happens with 10400....
10400 held but was it really tested......
To be continued.......today.....
The Dow ending near the lows isn't a good sign and having closed at half of the days high on Monday is also worth noting.........extra attention as it was done near the close......institutional activity.....!
Yes 10360 - 380 should be a critical area of support today. If it's breached then we should see a test of 10300.Racer said:important support level of 10370-80
Resistance still at 10500 and a breakthrough here could lead to 10700. Doesn't look likely at the moment.
Sentiment seems to be turning negative.
dc2000
Veteren member
- Messages
- 4,766
- Likes
- 129
10700. Doesn't look likely at the moment.
Watch this space baby watch this space
I'm now short Dow, Dax & FTSE.User said:Dow sill failing to deal with problem area.......
Back down to 10400.......
?
We'll see...
frugi
1
- Messages
- 1,843
- Likes
- 133
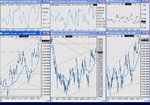
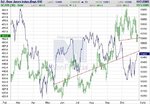
Those breadth divergences I was after yesterday conveniently appeared at the top of obvious channels. COMPX would have been the preferred short as it also traced out a perfect 1:1 of 79 points. I think we will retrace now to fill all those gaps.
Attachments
tradesmart
Experienced member
- Messages
- 1,286
- Likes
- 22
Kiss of Death.....?
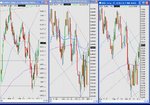
Had a very nice long from today’s action, but I’d be very surprised if the current rally truly has ‘legs’…
The 4 hr chart is showing very clearly that we are still in the ‘kiss of death’ setup with the index finding resistance at the underside of the breached triangle lower trendline….
Also Dow performance seems to have a direct correlation with yields in the 10year note bond market, and at the moment the bond market is falling with rising US interest rates, thus increasing yields – rising yields generally suck cash out of stocks..
True, none of this is definitive, and we all have to trade what we see; but there seem to be many stock negatives currently…..
(that said, I’ll be one of the first to go long if we have a major surge north on high volume….! 😉 )
Attachments
Keeping your eye on this little fellow does not hurt either 😉
http://www.futuresource.com/charts/charts.jsp?s=DJ&o=GCZ05&a=D&z=650x450&d=medium&b=LINE&st=
If you are of the view that gold at $460 is a lovely bottom of range long shooting for a breakout above $480 then you might have a view on where the money may be flowing from to fund this.
http://www.futuresource.com/charts/charts.jsp?s=DJ&o=GCZ05&a=D&z=650x450&d=medium&b=LINE&st=
If you are of the view that gold at $460 is a lovely bottom of range long shooting for a breakout above $480 then you might have a view on where the money may be flowing from to fund this.
frugi
1
- Messages
- 1,843
- Likes
- 133
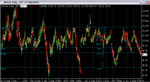
If you are of the view that the poor little fellow's head and shoulders would frighten a moose, then you might have a view on where the money may be flowing to, after his neck is broken for the second, fatal time. 😉
May the best neck win (if only it were that simple) :cheesy:
May the best neck win (if only it were that simple) :cheesy:
Attachments
macbonzo
Well-known member
- Messages
- 292
- Likes
- 6
I have to say, I think, tradesmart was right to mention the yield on the 10 year Treasury bond. It took a hell of a hike up (4.56 to 4.61) at the open yesterday and that really convinced me that the Dow would push down through 10400 quite easily. The fact that it didn't would indicate to me the bulls are in control for the moment. To shrug off such a rise in yields and it's implication for future interest rate rises was really pretty impressive.
My strategy for the next 4-6 weeks will be to long the Dow on weakness.
My strategy for the next 4-6 weeks will be to long the Dow on weakness.
tradesmart
Experienced member
- Messages
- 1,286
- Likes
- 22
Mr 10%.......
The Wall Street pump machine is in full swing now promising yet another ‘Santa Rally’ – they do it every year and they even get it right sometimes…… :cheesy:
Maybe they’re short on oil as well….. 😕
The Wall Street pump machine is in full swing now promising yet another ‘Santa Rally’ – they do it every year and they even get it right sometimes…… :cheesy:
The indices rallying against rising bond yields seems a bit strange, but maybe Wall Street figures that this is a bond ‘high’ and yields will fall from here…?!"You had enough of a sell-off in October that you created an oversold condition," said Barry Ritholtz, chief market strategist at Maxim Group. "We can rally to mid-December. We might back and fill for a week or two, but the rally will support a possible 10% move on the Nasdaq; the S&P can get up to 1,280, while the Dow maybe gets up another 500 to 1,000 points."
Maybe they’re short on oil as well….. 😕
Maybe they’re short on oil as well…..
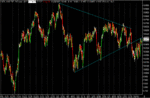
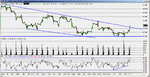
Take a look at the attached chart ..... It looks very much to me like oil may have formed a double bottom at $59 and the "downward channel" we were in was a bull flag which is just starting to break upwards.
Early days yet but if so we'll be seeing $70+ oil again in the near future!
Attachments
User
Experienced member
- Messages
- 1,170
- Likes
- 23
If we don't get a close above 10540 in Fridays session which would also conclude this week then the Dow would still remain a sell....
It has done well as it closed above 10500 but 10540 is the level on the weekly chart......The bulls might still be fooled........
It has done well as it closed above 10500 but 10540 is the level on the weekly chart......The bulls might still be fooled........
eatontrade
Guest
- Messages
- 147
- Likes
- 1
If you look at the Daily chart we have yet to close above the trend line. I'm looking for (hoping for) a pull back and a continuation of the move lowerjustyn said:Take a look at the attached chart ..... It looks very much to me like oil may have formed a double bottom at $59 and the "downward channel" we were in was a bull flag which is just starting to break upwards.
Early days yet but if so we'll be seeing $70+ oil again in the near future!
Similar threads
- Replies
- 1
- Views
- 4K
- Replies
- 1
- Views
- 5K