tradesmart
Experienced member
- Messages
- 1,286
- Likes
- 22
Last Night:-
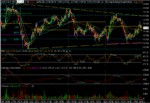
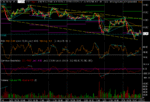
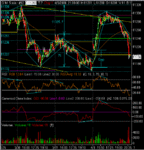
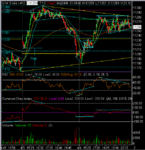
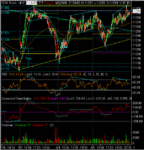
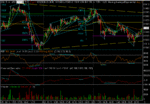
A 75 point tank in 60 mins to start the day from the 10.00hrsET news (another ‘magic moment’..!) courtesy of the market’s bêtes noir – rising bond yields and oil prices; but the fall arrested by the lower triangle support line..
Just a guess yesterday, but generally validated by the index today…. 😉
Good trading signals – the opening short from yesterday’s 11395 pivot, confirmed by ND RSI, crossover over of the 9/16sma’s… covered/go long, at the 11330 pivot, confirmed by PD RSI, crossover over of the 9/16sma’s; and a nice bounce to the 11365 pivot at the 61.8% fib retracement level…and reverse to 320ish support for an initially weak evening performance, but still managing a 40+ point rise from the 305 low..
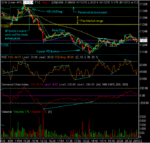
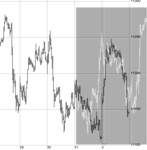
I suspect that the trading range will tighten within the triangle confines over the next few sessions leading up to the FED meeting on the 28th – the 100ish height of the triangle hints at a similar size move from the breakpoint, as and when it comes…
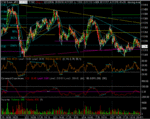
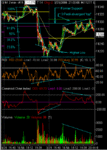
Yes....!a speculative triangle forming..
More volatility in the developing range to come
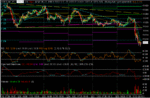
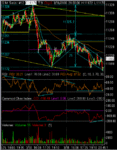
A 75 point tank in 60 mins to start the day from the 10.00hrsET news (another ‘magic moment’..!) courtesy of the market’s bêtes noir – rising bond yields and oil prices; but the fall arrested by the lower triangle support line..
Just a guess yesterday, but generally validated by the index today…. 😉
Good trading signals – the opening short from yesterday’s 11395 pivot, confirmed by ND RSI, crossover over of the 9/16sma’s… covered/go long, at the 11330 pivot, confirmed by PD RSI, crossover over of the 9/16sma’s; and a nice bounce to the 11365 pivot at the 61.8% fib retracement level…and reverse to 320ish support for an initially weak evening performance, but still managing a 40+ point rise from the 305 low..
I suspect that the trading range will tighten within the triangle confines over the next few sessions leading up to the FED meeting on the 28th – the 100ish height of the triangle hints at a similar size move from the breakpoint, as and when it comes…
Attachments
Last edited: