Where is market heading ? Short , Medium Term Grey's analysis

a) High of the day for INDU was 13029 @ 1452 which would have hit your stop but lets forget about this trade and look at your view from here on ward// Would you go long if yes when and what would be your entry ? what technical justification would you be having to convince yourself we are not going to HIT the March LOW?

Yes the INDU printed a high above 13020, but like I said I trade off the futures contracts, not the cash. There's an offset there, sometimes as big as 50 points depending on the expiration date. You can check the futures prices on the CBOT live page here. 13017 was the high as you can see by the attached chart.

Anyway, this is all an artificial debate because I'm not going to fool myself by telling me it won't get stopped out tomorrow.

I'll get back to you on the rest of your post later on, because it's 2 o' clock past midnight here :)

Edit: the market just spiked up to 13025, so I'm effectively stopped out on that position. I would still be short on the ES from 1425.
 

Attachments

  • cbot_live.GIF
    cbot_live.GIF
    6.7 KB · Views: 11
Last edited:
PS:_- I just realised i have not addressed one of your comments regarding day trading ,,, Yes I think day trading is a MUGS game for an average trader specially those with only basic knowledge of TA ,, There is too much evidence to support this claim and apprently the success rate is around 3% but donot quote me of this .
I class myself as one of those 3% .
Grey1

I'm not going to say it is easy. On the contrary. It requires enormous time and effort, and a decent capital to start from. Not to mention the stress for most aspiring traders will be much higher. As far the 3%, I don't know about that. The 5% rule has been so omniprevalent it became a self-fulfilling prophecy really. It'd be very interesting to see a broker show some statistics - if he has them - about the % of profitable traders amongst his clientèle.
 
I'm going to take the side of the "bulls" here for a minute to give you the arguments why I think going long in March was the right thing to do (with a target at resistance around 12900 has been hit obviously).

c) I also think you made another error to call the market change of trend technically,, You should have let the market to fall lets say 300 to establish the change of trend before calling the MARCH LOW

Ok, here are a couple of charts. The first one is the DOW Jones Industrial Average, the DOW as we all know it. The other one is the DOW Transports, which should be the 'leading indicator'. The last one is the VIX, a contrary indicator like I said before.

When the market dropped sharply in the beginning of this year, we exhausted into a temporary low in January ('X'). This can be seen by the huge volume and the immediate reaction up because price moved up about 500 points in one day. Going long here is very risky and not my style, although I do know some aggressive traders who go long off the selling climax. Anyway... Look at the transport charts and 'A' is that same low.

Two months later we test that low on the DOW Industrials 'Y'. But - and this is a first sign of divergence -the Transports sets in and makes a higher low! This is very significant and is confirmation that a long entry has a very high probability of succeeding. Notice how we have been making higher highs and higher lows ever since the March Low.

So to sum things up, these were my reasons to take a long in March instead of waiting till April for confirmation:
1. a selling climax on huge volume in the background usually exhausts the downmove
2. a re-test that fails to break below the January lows
3. at the same time the dow transports gives divergence and a higher low
4. the blue trendlines are broken in March
5. general consensus was very bearish, notice how in each market bottom the VIX was at it's highest

You see, I'm not just picking the bottom here, I have 5 arguments to substantiate for doing so.

.In my humble opinion you must stop GUESSING TOP or BOTTOMS ,, This is a bad habit which must be stopped ,, When I scalp a Euphoria / capitulation I do it with tiny pos size and very tight stop and I don't really class it as trading ,, only guessing and perhaps even gambling ,,,

I agree, you shouldn't try to pick tops & bottoms. That's why trendlines come in handy. Most people will try scalp against the trend, but they need to wait for the trendline to be broken. The odds of a reversal taking place after that will be much bigger.
 

Attachments

  • djia.GIF
    djia.GIF
    16.2 KB · Views: 11
  • tran.GIF
    tran.GIF
    15.3 KB · Views: 9
  • vix.GIF
    vix.GIF
    11.4 KB · Views: 13
Still here instead of sleeping, so I might as well make the reply now!

The current situation is
1) Smart money is positioning itself with the $ rise,,, WOuld we bet against smart money ?
No, I think the $ has seen the worst - at least for some time.

2) 65% of S&P500 are beating their estimates,, would we short the market ?
I don't track nor believe in estimates, reports, dividends, etc...

3) 3 of the top fund managers responsible for 1.1 trillion Dollar profit in 15 month have gone long and all positions filed with SEC.. do we really want go against them ?
No, if the smart money has positioned itself for a ride up, than we won't to jump along that train. No argument there. However, I'm not necessarily seeing 'the smart money' as the top fund managers. History has enough examples where big fund managers blow out...

4) Market is a forward looking mechanism which as a result ignores the current bad news( all discounted in the current price ) ,, With Interest rate @ 2% do we really think things are getting worse ?
Exactly! The current bad news has already been priced into the news. This is why markets plunged before the worst came out. Consumer confidence at 5 year low? Markets told the story 4 months ago.

5) Monthly , weekly and to day daily indicators based on market cycle have turned up ... would we really want to go against the cycle ? I use a fisher transform to measure the cycle ,,,others might use other indicators ,,, ( cycle analysis is the foundation of TA)
I'm going to be honest with you, until yesterday the downside scenario was very much in play. We spiked up to 13000 and closed below 12800. A continuation to the downside was needed but today we reversed and set in a new high since this year.

6) technology stocks lead the market ,,, Today the leading components of NASDAQ 100 blew away other sectors ,, do we really want to ignore this ?
The Nasdaq is flying indeed... the problem is I don't believe the techs to be the leading indicator when it comes from turning from bearish to bullish. Materials and energy sectors should signal a turn.

I'm open to suggestions, but I should point out that the "larger timeframe" has very little influence in my day-to-day trading. Actually, I think you'd hardly notice from my positions what the market is doing. I take short and long positions almost each day.
 
I'm going to take the side of the "bulls" here for a minute to give you the arguments why I think going long in March was the right thing to do (with a target at resistance around 12900 has been hit obviously).


Ok, here are a couple of charts. The first one is the DOW Jones Industrial Average, the DOW as we all know it. The other one is the DOW Transports, which should be the 'leading indicator'. The last one is the VIX, a contrary indicator like I said before.

When the market dropped sharply in the beginning of this year, we exhausted into a temporary low in January ('X'). This can be seen by the huge volume and the immediate reaction up because price moved up about 500 points in one day. Going long here is very risky and not my style, although I do know some aggressive traders who go long off the selling climax. Anyway... Look at the transport charts and 'A' is that same low.

Two months later we test that low on the DOW Industrials 'Y'. But - and this is a first sign of divergence -the Transports sets in and makes a higher low! This is very significant and is confirmation that a long entry has a very high probability of succeeding. Notice how we have been making higher highs and higher lows ever since the March Low.

So to sum things up, these were my reasons to take a long in March instead of waiting till April for confirmation:
1. a selling climax on huge volume in the background usually exhausts the downmove
2. a re-test that fails to break below the January lows
3. at the same time the dow transports gives divergence and a higher low
4. the blue trendlines are broken in March
5. general consensus was very bearish, notice how in each market bottom the VIX was at it's highest

You see, I'm not just picking the bottom here, I have 5 arguments to substantiate for doing so.


I agree, you shouldn't try to pick tops & bottoms. That's why trendlines come in handy. Most people will try scalp against the trend, but they need to wait for the trendline to be broken. The odds of a reversal taking place after that will be much bigger.

Sorry FW but ur argument is all after event analysis ,, I think any 1 with 2 month knowledge of TA can put couple of indicators to make a case AFTER EVENT .
Technicians are at best after they seen the MOVE and not before. you told me i should have gone long in JAN and now you are saying it would have beeb too risky ,, just does not add up... lets put the last case behind as we know what happend when you gave a short analysis ,,

Now lets go back to my question ,,, I need to know what does TA offer to a poor man like me.. does TA confirm a LONG SETUP now that we are over 13000 ? what is the entry and why ?

how can you be sure market wont hit the LOW March ? ,, I am just trying to show that TA cannot offer any guidlines or assurances even though we are over 13000 and only FA can ,,,
I found out that you have a Forum called DOW,, so it is interesting to hear your argument defending TA ,,

Do you think if DOW pulls back lets say 300 points is a good entry for a long set up or do you still see it as sign of a reversal to hit MArch LOW ?

Grey1
 
Sorry FW but ur argument is all after event analysis ,, I think any 1 with 2 month knowledge of TA can put couple of indicators to make a case AFTER EVENT .
That's not correct. First of all, none of those are indicators. Second of all, if you asked me the same question in March at the time of the re-test I would've show you exactly the same and gave you the exact same arguments. At that time in March the Transports set in a higher low, and that's something which was visible THEN, you didn't have to wait a week or a month to see that. If you know what you're looking for in advance, you'll know what to do when you see it, there's nothing hindsight about that.

Next to that, I make many analysis beforehand. I don't blame for not knowing, because I suspect you don't pay much attention of what goes on in the public threads. Let me give you one example. On 10 January I said that the smart money was unloading into 12900 levels and that we would move significantly lower. The post is in my private board, but the follow-up can be found here when 5 days later the market was already 400 points lower and I said we would continue much lower.

Another more recent one can be found in this exact thread. On Sunday I said the ES would find resistance at 1405. I did so earlier in this week and it reversed of that level yesterday. What do you make of that? I shorted twice from those levels and made a nice profit because I close out at the end of the day. Had I left my trade open, I would be losing money right now.

Technicians are at best after they seen the MOVE and not before. you told me i should have gone long in JAN and now you are saying it would have beeb too risky ,, just does not add up... lets put the last case behind as we know what happend when you gave a short analysis ,,
No, I said that going long in January was the best entry. Depending on one's risk tolerance he might take the trade or skip it. Like I said, I don't swing trade and even if I did, the stop placement was too wide to warrant the trade. But from a technical point of view that was the best, and first entry. Identifying a selling climax in real time really isn't that hard.

Now lets go back to my question ,,, I need to know what does TA offer to a poor man like me.. does TA confirm a LONG SETUP now that we are over 13000 ? what is the entry and why ?

No, we aren't "over 13000", we are still hovering around it. If you (a) didn't go long and January and (b) didn't buy the reversal in March, then (c) I can't help you if you want to jump on a moving train so late in the move.

how can you be sure market wont hit the LOW March ? ,, I am just trying to show that TA cannot offer any guidlines or assurances even though we are over 13000 and only FA can ,,,

TA shows principles, it doesn't give you assurances nor does FA or any other method. Assuming there are "assurances" means you are 100% sure of something. You can never be 100% sure of the future.

I found out that you have a Forum called DOW,, so it is interesting to hear your argument defending TA ,,
The public DOW thread is not mine, but I do have a private forum where people post live trades from several different indices: DAX, FTSE, DOW.

Do you think if DOW pulls back lets say 300 points is a good entry for a long set up or do you still see it as sign of a reversal to hit MArch LOW ?
Grey1

I'll answer this question in a separate post.
 
As per your request

Here are the entry points. Red are shorting points, green are long entries.
All of them can be detected in real time. The blue line is drawn from the left so you short at resistance and you go long at the bottom (for the reasons I stated in my previous post).

At "Z" we had a breakout above 12700 on confirmed volume. So - if you aren't long from March - than you wait for a retracement back to support to see if it was a valid BO. The green dot on the right of the chart confirms the entry.

Since the point in March where we set a higher low, we've been making higher highs all along the way. So shorting where I did was going against the intermediate term trend, but - at that time - still with the longer term downtrend.

Since there is another potential layer of resistance around 13000, going long now is too late. If - and that is a possibility I am open to - we break above 13000 on high volume - than the trend is turned decisively.

So I would be flat right now. I would wait to see which hand the market deals me. There are two scenarios I see: (1) the market breaks above 13000 but falls back immediately (spike) or (2) the market breaks above 13000 and leaves that behind. If (1) plays out I would - assuming I would be a swing trader - go short when price falls back below the range after the spike. If (2) plays out I would wait for a retracement to enter long again.

Keeping in mind that I would be long from the March lows. And you might not believe me on this, but the pattern that is playing out in these charts happens on intraday basis a lot. I post my trades on a daily basis in several threads, including analysis and motivation. I don't mind being wrong, because in the end what matters is that you are more right than wrong.

Goodnight for now!

PS: I hope next time I get to ask the questions; feels like I typed a whole book :)
 

Attachments

  • trades.GIF
    trades.GIF
    36.3 KB · Views: 25
So I would be flat right now. I would wait to see which hand the market deals me. There are two scenarios I see: (1) the market breaks above 13000 but falls back immediately (spike) or (2) the market breaks above 13000 and leaves that behind. If (1) plays out I would - assuming I would be a swing trader - go short when price falls back below the range after the spike. If (2) plays out I would wait for a retracement to enter long again.

Do you see any major significance in 13000 level? Does this NUMBER have any meaning for you to take a RISK with your capital ? Does TA tells you to do so ?

grey1
 
Do you see any major significance in 13000 level? Does this NUMBER have any meaning for you to take a RISK with your capital ? Does TA tells you to do so ?

grey1

TA does not "tell" what's going to happen, which is a common misconception amongst those who claim TA "does not work". TA works perfectly if you know how to use it. I'm willing to do a complete 10 days of daily analysis including trade setup and tactics for those who are interested. I've been doing it for a long time in the other threads, I see no reason why I couldn't do it here, if there's interest obviously. That way I could illustrate the principles and show you what the possibilities of TA are. This obviously isn't meant to prove my trading skills, because there will be losing trades, this can't be ignored.

As for 13000, I don't hold any special meaning to round numbers if that's what you're asking. The 12700-12800 area for instance was more important as resistance but 13000 is another hurdle. Not only because it's price resistance but it's also resistance in time (but that's a whole different story). If we can break free of this, than I believe we will see a major break indeed.

Grey1, I am backing you up here on your 'bull side' scenario for the reasons I stated before. My 'short' setup became invalidated yesterday. Everything was according to plan, including the Fed day when we closed below 12800. But a continuation to the downside was necessary and we didn't see that.

As for "risk", I don't swing trade because I believe the RISK is actually LESS by daytrading, despite what people might think at first. My stops on intraday trading are usually as wide as 1% of my account. If you want to take positions on a hourly or daily chart you need much wider stops, and thus you are placing more capital at risk.
 
If you don't look at the reason for the move then you are guessing the turning points and you never be any wiser to know if the rally is a fake or a true one,,,,

I believe this is where our views our fundamentally different.

My point is that the chart tells you what will happen next, not fundamentals. You never need to know WHY something is happening. This will probably fall on deaf ears as I'm under the impression the majority of the members on your private forum believe in fundamentals (correct me if I'm wrong). I'm still somewhat surprised it is called 'technical trader' though.

Besides, sometimes the reasons why price is moving are stupid. Price could be rising because the news is less worse than expected, or because some insiders are actively trying to promote their stock by all kinds of means. Manipulation goes on, at different scales, but only has a temporary effect. If the markets wants to rally, it will, good news or bad news won't make a difference in the end. The initial reaction to the news might make you frown, but it's the lasting reaction that proves the evidence.

Determining whether a move is fake or true in advance, is not the task of the technical analyst. The trader only has to act on what he sees in front of him. If price breaks above a range where it has been stuck in, the trader might go long. He has his stop to protect him and he has several tools to determine whether the move will last or be fake. Volume is one of the more important tools in this study.
 
Hi FW,

i'll vote for that, I think this would be useful

cheers
belflan

We would have to be very clear and specific about what the purpose would be though. Otherwise there will be a whole lot of "I meant", "I said that".. afterwards, which isn't the point...

The main reason would be to show that technical analysis, with complete disregard to anything fundamental, can work and will make you a profit. So if - after ten days of trading - I end up with a profit without using anything else then my tools(*) I will have succeeded, right?


(*)My tools are price, volume, demand, supply, trendlines, support and resistance. Nothing more, nothing less.
 
We would have to be very clear and specific about what the purpose would be though.

after ten days of trading - I end up with a profit without using anything else then my tools(*) I will have succeeded, right?


(*)My tools are price, volume, demand, supply, trendlines, support and resistance. Nothing more, nothing less.

Hi FW,

i would just be interested in seeing your approach discussed on TT.

i think if you make a loss within the 10days, it will still have been a success. A loss after 10days wouldn't mean your approach is wrong in my view.

cheers
belflan
 
Hi FW,

i would just be interested in seeing your approach discussed on TT.

i think if you make a loss within the 10days, it will still have been a success. A loss after 10days wouldn't mean your approach is wrong in my view.

cheers
belflan

Thanks. Well I see no reason why this can't start next week?
I could initiate a new thread, where I do my live trades and analysis and then another one where people could comment or ask questions. I would prefer to separate the analysis from the comments to keep it easy to read.
 
Aye...

Thanks. Well I see no reason why this can't start next week?
I could initiate a new thread, where I do my live trades and analysis and then another one where people could comment or ask questions. I would prefer to separate the analysis from the comments to keep it easy to read.

This will be very interesting FW99... Looking forward to it... :clap:

Currently trying to find my way in the murky world of fundamentals (to me anyway!) and I'm struggling... Would be very interesting to see you do your thing in real-time...

Cheers,

Magnus
 
This will be very interesting FW99... Looking forward to it... :clap:

Currently trying to find my way in the murky world of fundamentals (to me anyway!) and I'm struggling... Would be very interesting to see you do your thing in real-time...

Cheers,

Magnus

Thanks Magnus. There's always the chance I make a fool of myself! But in the end I know my approach works, and even if I should suffer losses, I'll know they are part of the system and no approach guarantees a 100% win ratio.

As for fundamentals... Wyckoff said:

You need never read anything on the financial page of your newspaper except the table of stock prices and volumes.

You need pay no attention to the news, earnings, dividend rates or statements of corporations.

You need never study the financial or the business situation.

You need not understand railroad or industrial statistics, the money market, the crop situation, the bank statements, foreign trade or the political situation.

You can absolutely ignore all the thousands of tips, rumors, reports and especially the so-called inside information that flood Wall Street.

You can discard all of these completely and finally.​
 
A distraction

Whilst Belflan and Yuppie are busy jumping aboard FWs bandwagon I will take an opposing view and say that I don’t think it is useful to see a thread on TA only analysis in this forum.

This is not because I am afraid that it might be shown that one can make money through TA alone nor is it any criticism of FW and his strategy and ability. I am sure that FW and others, including myself, have made money from TA alone.

The main reason why I think this exercise should be undertaken outside this forum is that the whole purpose of this forum is to present another way of looking at the markets – namely one that mixes TA and FA. If you want a TA only view there are hundreds of threads outside of this forum, including those of FW.

The problem is to do with focus. I’m sorry Belflan – you show a lot of interest in many different aspects of Grey1’s strategies opening up new threads for each, but it is as if you are using a blunderbuss to hit broadside many targets, but without seriously denting any. As soon as any new topic or poster arises you are off in another direction. Focus is what is needed now.

Grey1 has repeated time and time again that his main strategy and the one that really earns the cash is a long-term swing strategy based on fundamentals in a top-down approach, but mixed with technical analysis. Thus the market direction and sector strengths are determined, before evaluation of weak/strong stocks using CAPM for example, before calculation of profit targets. TA is used to evaluate present overbought/oversold conditions to determine appropriate entry/exit points for the long-term portfolio. Grey1 has repeatedly told us that intraday trading is not really part of his strategy, but is just an additional activity that he indulges in from time to time. He has advised against it but nonetheless shown us ways in which it might be carried out to reduce risk. He has shown us the difference between technical and non-technical days and how, on non-technical days, TA on its own i.e. evaluation of MACCI can suffice.

So I think that spending 10 days proving that you can make some money from TA (which I’m sure FW can do) doesn’t really address the purpose of Technical Trader which is to show how to make substantially more dosh longer term using a mix of TA/FA and for that reason I don’t think this distraction should be welcome here.

Charlton
 
By all means, I meant no "intrusion" whatsoever, but Grey1 insisted I continue my analysis, so that's what I did. If at any time people should feel this is not the place to do it, I'll take my charts back to where I had them before :) I'm not here to distract people or convince them into becoming daytraders. I can only say that I have found the truth to be in the chart and not in whatever indicator or fundamental reading.

He has shown us the difference between technical and non-technical days and how, on non-technical days, TA on its own i.e. evaluation of MACCI can suffice.

There is no such thing as a "non-technical day". People using RSI, CCI, MACCI and all sorts of indicators believe that when price is "overbought" or "oversold" it should respectively drop or rise. :rolleyes: It's no wonder they come to the conclusion "TA fails, it does not work".

When talking about TA, I am talking about TA in its purest form, the actual price/volume behavior of the market or instrument, on the assumption that price reflects all factors before an investor becomes aware of them through other means.

So I think that spending 10 days proving that you can make some money from TA (which I’m sure FW can do) doesn’t really address the purpose of Technical Trader which is to show how to make substantially more dosh longer term using a mix of TA/FA and for that reason I don’t think this distraction should be welcome here.

I'd be more than willing to do this analysis elsewhere. I have posted these things in my blog, in the private board, in the public DOW thread. If ultimately people think it's not suited here, I'm okay with that.

As for making more dosh by longer term trading, that's an easy one. If I'm correct Grey1 is long from April 17 around 12500. He's now about 500 points in profit. A rather conservative trader I know about makes about half of the average daily range on the DOW (which has been around 200 points for the last couple of weeks). This means he'd have from 10 trading days x 100 pts = 1000 points profit. The more short term a trader plays, the more profit he can make. Anyone doubting this, should seriously consider having a look at what pure TA traders manage. There are far better traders out there than me who could show you this.
 
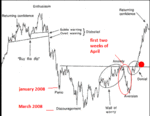
The Sentiment Cycle

I believe this is where we are now (red dot).

My assumption was that the period from anxiety to aversion (first two weeks of April would dip a lot lower), hence the hypothetical short position. Clearly the market was stronger. But this doesn't change the fact that going long in March on the retest, with confirmation of a higher low on the transports, was the right thing to do (if you're a medium or long term trader that is).
 

Attachments

  • sentiment.GIF
    sentiment.GIF
    10.6 KB · Views: 18
If I'm correct Grey1 is long from April 17 around 12500. He's now about 500 points in profit.

He should be doing better than that due to appropriate stock selection ie he should be substantially beating any of the indices. This, IMHO, is a very important point.

Assuming that this is not solely due to the beta of the chosen stocks, then this outperformance cannot be replicated (at the same level of risk) merely by using a higher leverage instrument such as futures.
 
Top