You are using an out of date browser. It may not display this or other websites correctly.
You should upgrade or use an alternative browser.
You should upgrade or use an alternative browser.
Trader333
Moderator
- Messages
- 8,766
- Likes
- 1,030
Do most trading systems work when the market is trending in either direction?
What happens when theres no clear trend, no trading until there is ?
In my view that is not correct. There are loads of approaches that work by shorting at resistance and buying at support. However, there is strong evidence to show that markets trend only around 30% of the time. So if you are a trend trader then don't trade when it is not trending and it really is that simple.
Paul
shadowninja
Legendary member
- Messages
- 5,524
- Likes
- 645
What Trader333 said. I am a trend trader. I just cannot trade successfully when it's ranging, so it's best to sit on my hands. Don't feel you have to be in a trade every day. That will kill your account.
Crap Buddist
Senior member
- Messages
- 2,458
- Likes
- 289
Wheres Wally ? 🙂
If you can distinguish between trend and non trend, then ...... ? 😀
Maybe just keep watchin charts for a few months.... mark up perhaps 3 stages, the begining of a trend, the middle and the end of a trend........ ? what do you notice? what can you see, I dunno , I mean you might see something different, behaviour at the sections.......
Do all that with hindsight then slowly in realtime you might begin to see, and think, stage 1, stage 2 stage 3...... or I cant see any bloody stages, therefore its rangebound at the mo or gyrating waiting for news maybe etc. ,
maybe look at the hi and low of the previous days action and see if a trend is there, find the trend.... a bit like wheres wally 🙂
what do you think , make sense ?
good luck mate....
Do most trading systems work when the market is trending in either direction?
What happens when theres no clear trend, no trading until there is ?
If you can distinguish between trend and non trend, then ...... ? 😀
Maybe just keep watchin charts for a few months.... mark up perhaps 3 stages, the begining of a trend, the middle and the end of a trend........ ? what do you notice? what can you see, I dunno , I mean you might see something different, behaviour at the sections.......
Do all that with hindsight then slowly in realtime you might begin to see, and think, stage 1, stage 2 stage 3...... or I cant see any bloody stages, therefore its rangebound at the mo or gyrating waiting for news maybe etc. ,
maybe look at the hi and low of the previous days action and see if a trend is there, find the trend.... a bit like wheres wally 🙂
what do you think , make sense ?
good luck mate....
Ampro is probably right about a trend, and Trader333 is right about the occurrence of a market trend.
A trend is considered formed when a few consecutive candlesticks / bars in a row show a clear direction ( either up or down ). Just like distribution of dots on a graph of lab experiment, a mean line drawn passes those candlesticks/ bars show the trend. It is more like the direction of a moving average line, irrespective of the time frame of the chart.
Example, my old work on a liquid US stocks, shows that 30 or more consecutive candlesticks / bars in a row, on a chart are good enough to indicate a trend. Variation of course exists on the illiquid stocks.
But this trait is not really similar on the major forex currency pairs. Difference market, particularly different currency pairs, has different dynamics, although some common and repetitive traits do exist among them.
A retracement ( pullback ) of a bullish rally ( uptrend ) on a 4- hour chart, if reduced down to 1-hour or 30-min chart, may show a clear ( and exploitable ) bearish rally ( downtrend ).
A rebound of a bearish rally ( downtrend ) on a 4-hour chart, if reduced down to 1-hour or 30-min chart, may show a clear ( and exploitable ) bullish rally ( uptrend ).
One thing for sure, a trend is formed only after a consecutive extension of price movement.
( In hindsight ), we may occasionally find a few minor bullish or bearish rallies at 1-hour chart, in a ranging market as shown on a 4-hour chart or chart of higher time frame.
Just like stock, in forex, we do have short-term, medium-term and long-term trend, based on different time-frame of a chart. Of course the exact definition of a trend is still very subjective and without a clear boundary.
Just my 2-cent...
Trader333
Moderator
- Messages
- 8,766
- Likes
- 1,030
I just cannot trade successfully when it's ranging
Not quite as I used to trade both and profitably but I choose not to trade when markets are not trending because that would require me to be in front of my pc far too much. I do however, take news trades on forex which also suits me because I know when they will occur. Compared to when I was trading US stocks, I have hugely reduced the amount of time that I trade as I am now a long term trend trader. It has also allowed me to further focus on diversifying income streams which is something I am a big believer in. My aim is to have almost completely passive incomes and doing this takes some careful planning.
Paul
shadowninja
Legendary member
- Messages
- 5,524
- Likes
- 645
Sorry, my comment was not a reflection of your trading style. I just meant that I can't trade when the market is going sideways. I end up making bad decisions. I like your thinking on multiple streams. When my account is big enough to work two different things I'll will be doing this, but at the moment I am only on currency.
(You may have noticed that I don't make much comment in the weekly FX threads simply because I am not monitoring things that detailed any more for the same reasons that it takes up too much time; I am much more comfortable placing trades that are meant to be open for 2-3 days or even a week. Means I can spend some time building my "dream" business, too.)
(You may have noticed that I don't make much comment in the weekly FX threads simply because I am not monitoring things that detailed any more for the same reasons that it takes up too much time; I am much more comfortable placing trades that are meant to be open for 2-3 days or even a week. Means I can spend some time building my "dream" business, too.)
You map out the range limits, you see how big a move between the two is, and decide if that's big enough to make a decent, consistent profit on.
Trends are subjective, during an uptrend (for example) there will still be vertical movement... an uptrend on a 1 hour chart might have a small counter trend retracement that, on a 5 minute chart, looks like a change to downtrend. (Hence the emphasis on looking at other timeframes when doing TA). Some people mention indicators like ADX - my opinion is that these are good for mechanical systems to aid filtering, but if your eye/brain combo is so bad it takes ADX/DMI to spot a trend you should give up.
A chart that is ranging can be traded provided the top and bottom are far enough apart to trade the legs up/down for profit - this will depend on what you are trading, and how... I know of a quite good system for finding 1 pt moves on the DOW for example, so somebody trading the actual Dow Future can pull $50 profit off several times a day, whilst a spreadbetter needs a 5 or 6 pt move to break even.... by trading the actual future you are several hundred $ up, the SB'er is doing well to break even... the platform used to trade the instrument has had an overwhelming effect on whether you are in profit or losing. Seeing a nice range on the chart can give you immense confidence that you are in the trade in the right direction, and that you know pretty much to the cent where you expect to end up. That's actually rather better than most trends can deliver, when it all goes well. (Who knows when a trend will end, whilst a well defined range can appear cast iron).
SO - in a ranging market you can do as well as in a trending one, but you have to know what you are doing, and picking the right platform is very important.
Dave
Trader333
Moderator
- Messages
- 8,766
- Likes
- 1,030
You map out the range limits, you see how big a move between the two is, and decide if that's big enough to make a decent, consistent profit on.
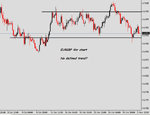
How does that work for the likes of EUR / USD where it is making new highs that have never been seen previously ?
Paul
shadowninja
Legendary member
- Messages
- 5,524
- Likes
- 645
I think he meant when it's going sideways.
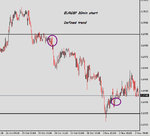
The question was 'what happens when there is no trend' - which I did indeed take as meaning a market that is going sideways...up, down, and sideways being pretty much the options on most charts, barring the occasional spot of absolute mayhem or large gap. I was suggesting that In a sideways market there is still a possibility to trade a range, but that you needed to be sure that the range was large enough to extract profit from. EURUSD is, according to my eyeballs, in an uptrend and has been since around Oct 2005, so doesn't meet the parameters of the thread opener's question, which is what I was addressing.
Fair point too -
I was (quickly, roughly) picking out the end of what's really a retracement in the longer uptrend that goes back to about Jan 2002 on weekly bars... on a shorter timeframe (say daily) it looks more like a swap to downtrend in early 2005 for a few months, anyone seeing that on daily bars who swapped to the higher timeframe would see it as still within the uptrend. Timeframe affects what you observe, and what you can make profit from. I'd be perfectly happy to exchange all that I've learned in the past 7 or so years for the unerring ability to answer the following accurately, consistently:
1 - Which way is it going
2 - How far will it go
Sadly number 2 is much harder than number 1, although I think there's a system to be built out of using my entries to time upcoming turning points in markets...it'd be something along the lines of 'Wait three more bars then take opposite position'.
🙂
Dave
E
EFXandy
Agreed
Dave,
Concerning your #2, what I have learned and used as a guage to determine the target, thus the extent to how far the move will go, is simple taking a ruler to my chart, and measuring how far it has gone so far. If a downmove has gone about 4 inches on my screen, and then breaks out to an uptrend, I look for roughly the same distance in the same angle. Sound trivial and too geometric, and I am still not sure if this is exactly what you were talking about, but it works for me, and has for the past few years.
Good Luck!
Andy Geller
[email protected]
www.efxgroup.com
Fair point too -
I was (quickly, roughly) picking out the end of what's really a retracement in the longer uptrend that goes back to about Jan 2002 on weekly bars... on a shorter timeframe (say daily) it looks more like a swap to downtrend in early 2005 for a few months, anyone seeing that on daily bars who swapped to the higher timeframe would see it as still within the uptrend. Timeframe affects what you observe, and what you can make profit from. I'd be perfectly happy to exchange all that I've learned in the past 7 or so years for the unerring ability to answer the following accurately, consistently:
1 - Which way is it going
2 - How far will it go
Sadly number 2 is much harder than number 1, although I think there's a system to be built out of using my entries to time upcoming turning points in markets...it'd be something along the lines of 'Wait three more bars then take opposite position'.
🙂
Dave
Dave,
Concerning your #2, what I have learned and used as a guage to determine the target, thus the extent to how far the move will go, is simple taking a ruler to my chart, and measuring how far it has gone so far. If a downmove has gone about 4 inches on my screen, and then breaks out to an uptrend, I look for roughly the same distance in the same angle. Sound trivial and too geometric, and I am still not sure if this is exactly what you were talking about, but it works for me, and has for the past few years.
Good Luck!
Andy Geller
[email protected]
www.efxgroup.com
Thanks for the reply,
there are rather a lot of methods you might use, Fib levels for example - fortunately perhaps the various methods don't work all the time, in the case of a Fib level you might look for hesitation as each level is touched, but you only know it's over when the fat lady has sung...
How far is not essential really, provided you can spot when the move is done - where you expected it to go ceases to be anything like as relevant to spotting when it has stopped climbing/falling. (It would just make it so much easier if one knew exactly when it was going to stop a few bars ahead of time <g>)
Similar threads
- Replies
- 37
- Views
- 14K
- Replies
- 0
- Views
- 2K