What are your stats ? Montecarlosimulation of Trading / Moneymangement

I think the trades/sample size needs to be increased and there needs to be longer and more frequent losing streaks programmed into the random generation. Also, I think I'd rather see the results as a normal/prob distribution curve rather than a line chart. Been trying to do it myself but my VBA isn't good enough :confused:

As for sample size 1800 trades is alot!! He SHOULD have a good representation of his sytem unles he has been realy lucky. Also ,you and fastcar are talking about this data like there is a spreadsheet with his data on it. Am I missing something i didnt see an Excel file in this thread and I have read the entire thing. Could you tell me where you see the line chart or data file? Thanks
 
I've been talking about the excel file all along...

Sorry to be so dense,...but I didnt see it. The only excel file I found was the one with the MC Sim in it. I dont see one with his trade data. Could you point me to the post?

Thanks
 
Hi guys,

Eegozi thanks for providing the file, I ran a simulation with 1000 trades each and 100 iterations and it looks quite promising. In terms of commissions I use zero as all trades are spreadbets and the spread (i.e. Only, implicit commssion which is itself higher already than if I had enough size to trade futures) was already reflected in the returns.

As per the title of the tread, I would also be interested in your stats and systems and how they look on a MC Sim: how many trades do you have as a sample, what are your ratios etc. It seems the only representation of actual data in this thread so far is mine......

I will need to do a deeper analysis on the trades realized R, as this concept is new to me and I need to understand it properly before applying it ( waiting for supertrader from Amazon now).

Cheers and have a nice weekend,

Yuppie

As for data from my system... I will provide what I have. I recently made some changes that seem quite promising. So far I have about 30 trades and was waiting for 100 trades to post more data. I do not day trade. i mostly swing trade so I only have about 6 trades on at a time and they last anywhere from about 3 days to 3 weeks. So it will take me a bit longer to have more meanigful data. But here it is so far. I realize this looks like a great system but I am sure it will show some more losers as I take more trades but take it with a grain of salt.

Trades = 30
Expectancy = 0.48R
Probability = 73.3%
Standard Deviation = 0.469
SQN = 3.62

I am currently using a somewhat discretionary system with some hard and fast rules for trend following. I am using usually 0.75% risk of capital per trade with an occassional trade at 1.25% and some at 0.35%. Depending on if it is a strong trend or a counter trend trade, respectively.

I know this seems a bit of a great set of data. So far my account shows this to be effective but I really need more trade data before I can say anything more definitive. I will say that this modification to my system has changed me from being mostly break even or slightly profitable to being definitely profitable over the last 3 months.

So there you have it,...at least what i have so far.

Good Luck.
 
Just wanted to say thank you for such a great thread/topic. Very much enjoyed reading through it. As a mechanical system trader I am very interested in this subject.

I was wondering whether one of you could take my current years figures and comment on it as I'm not 100% whether Ive got the specific ratios right...

939 trades

429 winners
510 losers

So this is a 45.7% win rate obviously.

Now I start to get confused a little and looking for guidance!

the 429 gross winners becomes 643.50 net (all worth 1.5x the 1 risk) So is that 1.5R?

But now this is where I get lost.

I have a set method of cutting my losers so the 510 losers becomes 403 (net)

643.50/403 = 1.6 ----- I presume this is my win/lose ratio?

Not sure what figures to use in the spreadsheet... would love to run some mc tests on these figures!

I am currently trading this system with 1.5% risk per trade.

Any help is much appreciated guys! :clap:

T
 
I was wondering whether one of you could take my current years figures and comment on it as I'm not 100% whether Ive got the specific ratios right...

939 trades

429 winners
510 losers

So this is a 45.7% win rate obviously.

the 429 gross winners becomes 643.50 net (all worth 1.5x the 1 risk) So is that 1.5R?

But now this is where I get lost.

I have a set method of cutting my losers so the 510 losers becomes 403 (net)

643.50/403 = 1.6 ----- I presume this is my win/lose ratio?

Your win rate is x/100=429/939=45.7%
You state that every winner is equal to 1.5X your loser. So your winners are always 1.5R.

Your next few lines are confusing. I think I know what you are saying, but I'm not certain. It would be best if we just 'don't go there'.

Instead, start over, and give us the right information.

Win rate is one thing... that's fine.

Now, give us how much your winners made NET of commissions.

Then, give us how much your losers lost NET of commissions.

True break even trades are extremely rare (when you include brokerage). If you lose 1 cent after commissions, that's a loser and put it into the loser column. If you win 1 cent, that's NOT BREAKEVEN, put it into the winners column.

The standard deviation of your results (including commissions).

Get back with this, and we can calculate Profit Factor, Expectancy and SQN to start with...

fastcar:cool:
 
Thanks for the reply fastcar, I appreciate you helping me with this.

I dont operate a breakeven method so I dont have any. I am spreadbetting in the uk so only commision is the spread which are factored in to the figures.

Say I place £100 a trade.

My winning total equal £64350 (429 winners)

Now I have 510 Losing trades,

But only 298 were full losers (£29800)

The other 212 were half losers (212*£50 = £10600)

Total Losers £40400

Not sure about deviation you'll have to help me!

Thank you again, hopefully I have given you good information?

T
 
Just wanted to say thank you for such a great thread/topic. Very much enjoyed reading through it. As a mechanical system trader I am very interested in this subject.

I was wondering whether one of you could take my current years figures and comment on it as I'm not 100% whether Ive got the specific ratios right...

939 trades

429 winners
510 losers

So this is a 45.7% win rate obviously.

Now I start to get confused a little and looking for guidance!

the 429 gross winners becomes 643.50 net (all worth 1.5x the 1 risk) So is that 1.5R?

But now this is where I get lost.

I have a set method of cutting my losers so the 510 losers becomes 403 (net)

643.50/403 = 1.6 ----- I presume this is my win/lose ratio?

Not sure what figures to use in the spreadsheet... would love to run some mc tests on these figures!

I am currently trading this system with 1.5% risk per trade.

Any help is much appreciated guys! :clap:

T

Your correct on Probability Win rate = % winners/ total trades = 429/939 = 45.7%

Your Win/Lose Ratio is more commonly called a Profit Factor = 643.5/403 = 1.6 profit factor...Most people strive for 2 or better as ideal.

Your Expectancy = (% win * Avg Win Profit) -(% lose * Avg Lose Profit) = (.457 * $643.50) - (.543 * $429) = $61.13

This expectancy is being expressed in terms of dollars (profit). To get an Expectancy in terms of risk you divide this by the average risk per trade ($403). That gives $61.13/$403 = .152 R

Now that you know this a few things come to light. You are risking 1.5% as you say and that is probably high for a system that has only 45% win rate. However, that will depend on how you feel about draw down and ruin. Is ruin defined as 20% loss or 100% loss? Each one of us defines this differently. Run a MC Sim with these numbers and see the potential downside of this system and see if it is satisfactory. Also look at your expectancy and see what you can do to raise that. It is not bad but not great either. In my studies of systems it has become very obvious to me that you need at least 2 of the following 3 things to be as HIGH as possible. 1) Win Rate (yours is average I would say) 2) Expectancy (Yours is average or below average I would say) 3) Profit factor (average as well). See what you can do to your system to refine these and make them better.

This is just my opinion based on your stats.

Good Luck
 
Oh,...I didnt see your last post. Must have happened while I was typing. I will try to look at your numbers to see if my calc need to be updated.
 
Your Win/Lose Ratio is more commonly called a Profit Factor = 643.5/403 = 1.6 profit factor...Most people strive for 2 or better as ideal.

This is the payoff ratio. The profit factor is the sum of winners divided by the sum of losers.

See this blog for details and some useful derivations and insight.
 
Thanks for the reply fastcar, I appreciate you helping me with this.

I dont operate a breakeven method so I dont have any. I am spreadbetting in the uk so only commision is the spread which are factored in to the figures.

Say I place £100 a trade.

My winning total equal £64350 (429 winners)

Now I have 510 Losing trades,

But only 298 were full losers (£29800)

The other 212 were half losers (212*£50 = £10600)

Total Losers £40400

Not sure about deviation you'll have to help me!

Thank you again, hopefully I have given you good information?

T

Hi TJZ,

Ok, this is a great start. Also, I like that your numbers include all expenses. Many traders just don't get that stats without commissions are meaningless.

So, net winnings-net losses/number of trades = expectancy.

64350-40400= 23950. Divided by 939=25.506

Congratulations. You have a positive expectancy system, which, including brokerage makes 25.506 pounds per trade (Expectancy).

Expectancy is the average result one would 'expect' based on past trading results.

You have a Profit Factor of 1.5928. This is equal to net winnings divided by net losses.

Do you see how easy these two very useful statistics were to generate based on only three pieces of information (number of trades, total winnings and total losses)?

Now, for some more interesting detail:

Your average winner was 64350 divided by 429 = 150
Your average loser was 40400 divided by 510 = 79.216

Your average 'R multiple' is 150 divided by 79.216 = 1.8935

As stated before your win rate is 45.687%

CONGRATULATIONS! You have a way to win nearly half of your trades while keeping your average loser just over half the size of your average winner. This is very good indeed.

Now, I'll help you calculate your standard deviation if you have excel. Enter all 939 trades results into column 'A'. On row 940 enter the following formula into the cell underneath your column '=stdev(a1:a939)' Don't include the quotes ;)

Report back the result.

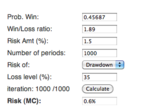
BTW, just FYI, a system like this (with a lower win rate) while profitable can have surprisingly deep drawdowns, even with very conservative money management, even when everything is working 'normal'! The trick is to stick with the system. For example, with just 1000 simulations of 1000 trades, your system reported a 16% chance of a 25% drawdown, and only when I increased the drawdown to 35%, did the chances get closer to zero (.6%). See attached.

I backed off your leverage to 1% and got a near zero chance of a 25% drawdown on 1000 iterations (not shown). If you don't like drawdowns (and if you are experienced, you'll know what I mean!) you may consider reducing your leverage to 1%. If your system gives you a lot of OPPORTUNITY (many trades per week or day) than you can still do very well with these numbers, even with very low leverage (1%) - assuming you continue to compile similar results going forward, of course.

Kind Regards,

fastcar
 

Attachments

  • 2011-10-08MC.png
    2011-10-08MC.png
    27.7 KB · Views: 186
Last edited:
Hi TJZ,

Ok, this is a great start....
So, net winnings-net losses/number of trades = expectancy.

64350-40400= 23950. Divided by 939=25.506

Congratulations. You have a positive expectancy system, which, including brokerage makes 25.506 pounds per trade (Expectancy).

Sorry,...This is incorrect.

Expectancy = (Probability of Win * Average Win) – (Probability of Loss * Average Loss)

Therefore with these numbers:
Expectancy Formula = {.457 * (64350/510)} - {.543 * (40400/429)) = (.457 * 126.18) - (.547 * 94.17) = 57.66 - 51.51 = 6.15

See here for more details. Trading 101: Expectancy
 
Sorry,...This is incorrect.

Expectancy = (Probability of Win * Average Win) – (Probability of Loss * Average Loss)

Therefore with these numbers:
Expectancy Formula = {.457 * (64350/510)} - {.543 * (40400/429)) = (.457 * 126.18) - (.547 * 94.17) = 57.66 - 51.51 = 6.15

Fastcar is correct and you are wrong. I tried to point out to you before that you don't understand the expectancy formula. The numbers you are using are wrong, 510 is the number of losers and 429 is the number of winners. If you substitute the correct numbers then you have:

Expectancy Formula = {.457 * (64350/429)} - {.543 * (40400/510)) = 25.53

But as a matter of fact, fastcar is twice correct. The fancy expectancy formula is just equivalent to the average trade, which is, as fastcar pointed out, equal to:

(sum winners - sum losers)/total trades

You see how some people made a very big thing out of a very simple formula, they renamed it expectancy and are selling it to confused geeks?

As a matter of fact, in the blog post below you can see that the fancy expectancy is equivalent to the trivial statement that the net profit is greater than zero:

What is a trading “edge”? – Part II | Price Action Lab Blog
 
Fastcar is correct and you are wrong.

Expectancy Formula = {.457 * (64350/429)} - {.543 * (40400/510)) = 25.53

You're right I replaced wins and losses incorrectly. Should have used 429 on the left side and 510 on the right.
 
Interesting Thread,

Im Currently working on gathering my $1000 deposit, and this is my blueprint I have worked on For almost a year.

25% per trade, 50/1 leverage

I trade Oanda, and stats are Horr--i--ble for record keeping purposes, unless there is something Im missing.

I hit 97%, and with all due respect, its really 100%, but PC lag Have biten me for a pip here and there, and a loss is a loss..

I have ran my system for 3 months, on both MT4 and Java Platform for Oanda, and Im consistant with both platform. However, I prefer MT4, because my actions are faster, and its simple to close and open and control..

My system is very fast, and 1 stumble can hurt, and I found on Java, there are many chances to stumble.

I run my money managment on a 20 trade day cycle, or 2000 pips, Rinse and repeat.. Risk is the same, 1 pip at a time.

I run cycles, because, really, no-one is perfect, and funny things happen in life.

When I get my 100 pips a day, Im close to around 25% a day on opening daily balance.

I practiced, NOT TO LOSE, I go in each trade, confident, Im going to profit, and expect to come out in profit.

My longest win streak is 128 wins,

I increase my lots per 25% allowance per balance daily.

I scale-in, or average up/down, whatever you may call it.

I give myself 3 trade max at one time. ALTHOUGHT, the goal is 1 trade per run. But if I feel a fast drop, I will throw another trade in the mix. But if it goes against me, still confident it will come my way, I place a trade on the level off by tick chart movement. And collect 1-3 pips as soon as possible, while, still having line to let run a bit, and still sweep up the back pips with my crawler trade, till I colllect on my initial trade.

So, while I expect to just get 2-3 pips on first trade, when the smoke clears, I might end up with 20-25 pips before my first trade is collected. again, thats all and good, but really, that is not the situation i want to be in, simple because it tells me I made a bad first move, either to early, or just straight bad.

I trade with the obviouse Trend, and the only time i waiver, is a big candle or something like that, that thru practice, I see happen instantly, and impulsivly..

I Love this Career,

Great Profits to all the week,
 
Last edited:
Thank you for everyone for helping me with this. It helps my confidence to know my trading is looking ok in terms of the calculations which I am not too good at if i'm honest.

Thanks to fastcar for promoting the fact I should be trading at 1% to keep drawdowns to a minimum. It has always been my intention to reduce the 1.5% per trade to 1% when my account has grown bigger, so for now I will deal with the added risk of higher dd to grow the account more quickly.

I just wanted to give a little history how I ended up trading my system and would love some input on another aspect of this topic:

Do these figures ACTUALLY help in the real world when markets can change....

Ok before you all start shouting at me, let me explain...

I started to get in to mechanical trading around a year ago and realised this suited my personality better than discretionary decisions. At the time I met another guy who was making very good profits from a method which was using the same structure as mine but he had put a different spin on things making everything 100% mechanical.

I was shown a years period of trading this method and the results were quite simply astonishing...

1255 trades
702 wins (all at 1:1)
402 losses(Cut short to a net 360 (1:1))
151 Breakevens

This meant the winners to losers ratio was nearly 2:1 (1.95)

I honestly thought this was the holy grail. There had never been a losing month and each months profits were amazing. So I put all my time and effort in to it and he took time out to mentor me for endless hours for which I will be forever in his debt.

Now you would think with a sample size of 1255 trades that this was a well robust solid trading system.

I then decided to test the system on the 12 months before the original results had started. This took me many nights of eyestrain to achieve (did this manually, best way to test IMO), everything was done correctly and the data I was using was correct to the best of my knowledge. (Alpari and Oanda)

All of a sudden the win to losses was 1.1:1, there were losing months (3 months in a row!) and it would have been an absolute nightmare to trade. I know there are always drawdowns but for 8 months of the year it struggled severly...

Obviously this is how I ended up where I currently am with my own method of trading, which although hasnt got the high 1.95 ratio as before, has performed well on the last 2 years with the same kind of figures throughout! I still have to find time to backtest 2008-2009 but with live trading taking up my time at the moment it is difficult!

I guess the point of my post is that although we can calculate our expectancys, our profit ratios etc etc etc does it really matter considering the market can change at any time and all of a sudden the trading method you have used for the last year or so just stops working!!!!

Would love some brainstorming here!

Cheers again guys, you lot know your stuff when its comes to math/formulas!

T
 
As a matter of fact, in the blog post below you can see that the fancy expectancy is equivalent to the trivial statement that the net profit is greater than zero:

I think we agree more than we disagree. You seem to think I think Expectancy is the only thing that matters. I dont. Expectancy and Profit Factor use formulas to show something that SHOULD be intuitive and obvious to a 3rd grader. If I have $25K acct and I make $1K in a month then by definition I have traded a positive expectancy system with a profit factor greater than 1 because winners were greater than losers (ie,.expectancy>0). You dont need as you say "fancy" formulas to see that.

However, where these formulas are helpful (at least for me) is that they help manage risk. If I have a $50 expectancy per trade based on risking $100 then I have a 0.5R expectancy. BUT I could potentially make that $500 if I were willing to risk $1000 on the same system. If I only have $25k to trade then thats a 4% risk instead of 0.4% risk. These stats simply help you identify your profit within the terms of risk and draw down and risk of ruin. Here is where stats really help. You can make a certain amount of money but at what risk....stats and formulas help you quantify this.

I had never seen the priceactionlab site that you have posted a few times but I have just sifted through it a bit and largely agree with you and what the site tries to explain. In fact this particular post on "What is an edge?" I think says what I am trying to convey.

What is a trading “edge”? | Price Action Lab Blog

Reward should be taken in the context of the amount of risk taken to achieve it. When comparing systems the one system with LOWER risk to achieve the same reward is best. In my opinion formulas help me determine this more easily.
 
Important Stats, Market Type, Trading Objectives.

Thanks to fastcar for promoting the fact I should be trading at 1% to keep drawdowns to a minimum. It has always been my intention to reduce the 1.5% per trade to 1% when my account has grown bigger, so for now I will deal with the added risk of higher dd to grow the account more quickly.

YW. Since you related how a similar system backtested poorly during a certain period, I would reduce leverage as soon as you are able.

1255 trades
702 wins (all at 1:1)
402 losses(Cut short to a net 360 (1:1))
151 Breakevens

What is a win at '1:1' mean? How do you cut short 402 losses into 360 '1:1' losses? (rhetorical) I realize these numbers mean something to you, but they might not to a lot of other readers.

If we could get in the habit of listing the number of winners and the number of losers and the net winnings and losses, that would tell us 90% of what we need to know about your system.

Again, there is rarely such a thing as a 'breakeven' trade when commissions are included, and one should just decide which column to add such trades. If you trade FX and have a number of true break-even trades, just decide which column to put them into.

Break-evens into 'Winners'. This is for those who feel they 'win' when they don't lose. Good for those who feel better about a higher win rate. It boosts your win rate, and lowers your Payoff Ratio.

Break-evens into 'Losers'. This is for those who feel they made no money after investing their valuable time into trading. Good for those who like to see a high Reward to Risk ratio. It lowers your win rate but boosts your Payoff Ratio (Reward to Risk Ratio).

Decide which method you prefer, and stick with it.

Another item that would be useful is to list over what period of time the data was collected (how many days, weeks, months etc.)

...although we can calculate our expectancys, our profit ratios etc etc etc does it really matter considering the market can change at any time and all of a sudden the trading method you have used for the last year or so just stops working!!!!

TJZ, you should very clearly understand the two basic market types: trending and sideways. You must have ways of determining which type you are looking at before your trade goes on. Lastly, you MUST know how your system performs in each market. You can create an outstanding system for one market type that will destroy your account in the other market type. I suspect this explains the system's variability you report.

Furthermore, WHAT ARE YOUR OBJECTIVES? This is one reason top traders keep system statistics.

Many spend an inordinate amount of time at trading. Is it worth it? How much do you need to make in order for it to be worth it?

PAIN. If you have been trading long enough to sustain a serious drawdown, you have learned that trading is 100% psychological. If you start falling apart when you are -30%, and start making mistakes, skipping trades, breaking rules, losing sleep, etc. then one of your objectives may be to have no more than a 25% drawdown.

Your system has rules, and let's say for arguments sake it is complete (no more tweaking). The only way to change the likely size of your drawdown is through money management (position size).

The only way to start determining either of the above (likely returns, likely drawdowns) is by keeping good records, and using this data properly, through simulations. Further, there is the possibility that your system's characteristics (statistics) will not allow you to meet your objectives. If this is true, wouldn't you like to know?

None of this is new, but has been written about extensively. Van K. Tharp's book Super Trader, if nothing else, helps to get you thinking about some of these important questions.

Hope that helps,

fastcar
 
Last edited:
Re: Important Stats, Market Type, Trading Objectives.

YW. Since you related how a similar system backtested poorly during a certain period, I would reduce leverage as soon as you are able.


What is a win at '1:1' mean? How do you cut short 402 losses into 360 '1:1' losses? (rhetorical) I realize these numbers mean something to you, but they might not to a lot of other readers.

If we could get in the habit of listing the number of winners and the number of losers and the net winnings and losses, that would tell us 90% of what we need to know about your system.

Again, there is rarely such a thing as a 'breakeven' trade when commissions are included, and one should just decide which column to add such trades. If you trade FX and have a number of true break-even trades, just decide which column to put them into.

Break-evens into 'Winners'. This is for those who feel they 'win' when they don't lose. Good for those who feel better about a higher win rate. It boosts your win rate, and lowers your Payoff Ratio.

Break-evens into 'Losers'. This is for those who feel they made no money after investing their valuable time into trading. Good for those who like to see a high Reward to Risk ratio. It lowers your win rate but boosts your Payoff Ratio (Reward to Risk Ratio).

Decide which method you prefer, and stick with it.

Another item that would be useful is to list over what period of time the data was collected (how many days, weeks, months etc.)


TJZ, you should very clearly understand the two basic market types: trending and sideways. You must have ways of determining which type you are looking at before your trade goes on. Lastly, you MUST know how your system performs in each market. You can create an outstanding system for one market type that will destroy your account in the other market type. I suspect this explains the system's variability you report.

Furthermore, WHAT ARE YOUR OBJECTIVES? This is one reason top traders keep system statistics.

Many spend an inordinate amount of time at trading. Is it worth it? How much do you need to make in order for it to be worth it?

PAIN. If you have been trading long enough to sustain a serious drawdown, you have learned that trading is 100% psychological. If you start falling apart when you are -30%, and start making mistakes, skipping trades, breaking rules, losing sleep, etc. then one of your objectives may be to have no more than a 25% drawdown.

Your system has rules, and let's say for arguments sake it is complete (no more tweaking). The only way to change the likely size of your drawdown is through money management (position size).

The only way to start determining either of the above (likely returns, likely drawdowns) is by keeping good records, and using this data properly, through simulations. Further, there is the possibility that your system's characteristics (statistics) will not allow you to meet your objectives. If this is true, wouldn't you like to know?

None of this is new, but has been written about extensively. Van K. Tharp's book Super Trader, if nothing else, helps to get you thinking about some of these important questions.

Hope that helps,

fastcar
+1...well said.(y)
 
Top