Calling all System Developers...

OK that all makes sense. Your backtest results looked good and I was curious about your results since your last post in March but if you are still working on the system, there won't be any results yet.

Long term, if your #'s produce the results from above, there are many people who would pay to trade your system. And if you're not independently wealthy, then this is always an attractive path. And IMO, there is no better time than now to start testing trading systems on real time data. Paper trading is free and can be automated.


Hello Zig Zag,

Thanks for your comments.

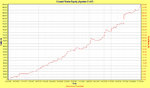
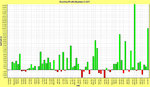
The current version of the system (which I'm still working on) is now quite a lot different to what was posted at the start of this thread. From memory the net return is now around 28% per Annum with a MaxDD of around 6%. Not that it really matters in terms of overall performance but the win rate has also increased to just over 50%. This metric may provide some level of "comfort" when trading live although I intend to follow the system's signals whatever the outcome of each trade during trading. It should be noted that I do have a particular metric which I will use for monitoring the system's performance while trading and should it be met, the system would be turned off, otherwise the system will be simply followed.

The improvements made, thus far, have been based around my own new ideas for developing Entry and Exit conditions as opposed to simple optimisation of the original system. There has been some tweaking of some values (which may contribute to some level of curve-fitting) but I don't believe the changes made to these values will impact too much on overall robustness of the system, as the variables used only contribute a small amount to the overall system's conditions for entering and exiting.

I shall post Monte Carlo results for this latest incarnation over the next day or so, purely for an update to this thread, and would welcome comments on those results at that time.

However, in should be noted that the system is yet to be exposed to any "out-of-sample" data (which is the first "real" test) although I do intend to complete this step within the next week or so (time permitting!!). I expect the performance of the overall system to drop during this phase (for obvious reasons) but feel confident that the overall performance will remain within the boundaries of what I'm hoping to achieve long-term.

FYI The in-sample data period was between 1998 & 2004, where the UK Mkrt experienced all three Mrkt conditions (Ranging , Bear and Bull Mrkt).


Regarding your comment on paper-trading, How would one automate this? My approach was to simply paper trade the system for a period of time (after completing forward-testing) and assuming performance was as expected during this period, simply introduce real money.

Chorlton
 
If it as all possible to replicate those returns in the future, I for one could be your first customer. 25% YOY is hard to beat. Does that assume $0 commissions? I've seen some systems that need 75% annual returns to make up for all the trading commission losses just to beat the S&P500.

If you ever decide to market your system (and you should if your returns are as noted), reputable vendors will use a third party tracking system to track and monitor performance. The two more popular systems I've seen are collective2.com and timertrac.com.

Your "out of sample" data may as well be current data. Paper trading through either of those sites above is a simple matter of entering your recommended trades into their system. They will track your performance automatically as you enter and exit positions. Post a link to your system once you have it set up - I'd be interested in following your system to see how you perform. If it's attractive, I may buy in.
 
Hello All,

I've been busy over the last few months re-evaluating and modifying my current system. I have posted Monte Carlo results of it below and, as usual, would welcome constructive comments, observations, etc on it.

To get the ball-rolling here are a few comments & observations of my own:

- The testing period was Jan 1998 to Dec 2004 (inclusive)

As the System has been developed to trade the constituents of the FTSE250, the issue of Survivorship Bias could be a concern. However, I have already attempted to discuss this on another thread

http://www.trade2win.com/boards/mechanical-systems-trading/33526-dealing-survivorship-bias.html

- The system has been orignally designed to increase my capital base (instead of creating another income stream) and as such I pyramid Profits back into the System.

Regarding the Results below:

- There is a large difference between the number of trades processed and those that are actually executed.

The reason for this is lack of capital !!! The only way I can resolve this is to either (i) increase my captial base considerably (which I am unable to do) or (ii) look towards the use of leverage. The other idea is to simply ignore this difference as the Monte Carlo testing should give me a good indication as to the possible end results depending on which order of trades I actually take while trading.

- The average number of trades taken is 272, which equates to roughly 1 per week. One of the original requirements of the system was that it would be easy & not time-consuming to trade so I am happy with this figure.

- One concern I have is the amount of variation I have in the Profit Stats. (333% to 698%) To be honest, I’m not sure how I can reduce this and would welcome any ideas.

- MaxDD is very low IMO, which again was one of my original requirements of the System.

As a final point, it should be noted that the results are based on “in-sample” data only. As stated in a previous post, the next step will be to run the system on “out-sample” data, and this will be the first real test to see how robust the system is moving forward.

Results:

Simulation Summary
Simulation Date: 8/07/2008
Simulation Time: 6:52:57 PM
Simulation Duration: 142.86 seconds

Trade Parameters
Initial Capital: $50,000.00
Portfolio Limit: 100.00%
Maximum number of open positions: 100
Automatically Use Position Size Model from database: No
Default Position Size Model: Fixed Percent Risk
Percentage of capital risked per trade: 1.00%
Position size limit: 10.00%
Portfolio Heat: 100.00%
Pyramid profits: Yes
Transaction cost (Trade Entry): $15.00
Transaction cost (Trade Exit): $15.00


Trade Preferences
Trading Instrument: Stocks
Break Even Trades: Process separately
Trade Position Type: Process all trades
Minimum Trade Size: $0.00
Pyramid Trades: No
Use Level Zero trades only: Yes

Simulation Stats
Number of trade simulations: 20000
Trades processed per simulation: 761
Maximum Number of Trades Executed: 296
Average Number of Trades Executed: 272
Minimum Number of Trades Executed: 253
Standard Deviation: 4.91

Profit Stats
Maximum Profit: $348,830.43 (697.66%)
Average Profit: $244,631.55 (489.26%)
Minimum Profit: $166,545.99 (333.09%)
Standard Deviation: $28,332.50 (56.66%)
Probability of Profit: 100.00%
Probability of Loss: 0.00%

Percent Winning Trade Stats
Maximum percentage of winning trades: 57.63%
Average percentage of winning trades: 52.16%
Minimum percentage of winning trades: 45.61%
Standard Deviation: 1.45%

Percent Losing Trade Stats
Maximum percentage of losing trades: 54.39%
Average percentage of losing Trades: 47.84%
Minimum percentage of losing trades: 42.37%
Standard Deviation: 1.45%

Average Relative Dollar Drawdown Stats
Maximum of the Average Relative Dollar Drawdown: $1,039.71
Average of the Average Relative Dollar Drawdown: $656.84
Minimum of the Average Relative Dollar Drawdown: $424.52
Standard Deviation: $80.55

Average Relative Percent Drawdown Stats
Maximum of the Average Relative Percent Drawdown: 0.6098%
Average of the Average Relative Percent Drawdown: 0.4299%
Minimum of the Average Relative Percent Drawdown: 0.3192%
Standard Deviation: 0.0359%

Maximum Peak-to-Valley Dollar Drawdown Stats
Maximum Absolute Dollar Drawdown: $16,002.37
Average Absolute Dollar Drawdown: $8,497.62
Minimum Absolute Dollar Drawdown: $6,353.95
Standard Deviation: $874.65

Maximum Peak-to-Valley Percent Drawdown Stats
Maximum Absolute Percent Drawdown: 6.5772%
Average Absolute Percent Drawdown: 4.6487%
Minimum Absolute Percent Drawdown: 4.4108%
Standard Deviation: 0.2103%


regards,

Chorlton
 
Here are a few charts including the Equity Curve for the above system .....
 

Attachments

  • EC.jpg
    EC.jpg
    164.7 KB · Views: 208
  • MC.jpg
    MC.jpg
    207.1 KB · Views: 220
Here are a few charts including the Equity Curve for the above system .....

Hello Chorlton,

A few observations;

The equity curve and monthly returns look good - very tradeable on the face of it.

It's not clear what your average profit per trade is (I've probably missed it) but note that you should expect to pay spreads of around 1 - 2% for stocks in the FTSE 250. The FTSE is far less liquid than US stock.

I'd be really concerned about survivorship bias - as discussed before - I would build a random list of stocks from the FTSE all share (I know you have issues with a complete list, but can you build a substantial list of candidates without issue?)

Build a random list of stocks from the data I sent you? If your data provider doesn't support it, use Yahoo. You've touched on issues with yahoo data, so don't trust it outright - but if results drop off significantly, alarm bells should ring at least.

I would look at FTSE250 stocks if not - at least theres 2 ways into this index - up and down. But I'd really try for the other options.

Paper trade your results. Or as suggested, go through collective 2. Costs about $60 for a 6 month listing, I believe. You will get some performance stats, and perhaps interest from others through subs.

I would look to trade more stocks using margin. I would spreadbet these stocks through CMC. I wont enter a debate about the pro's and cons of SB here, but suffice to say it's what I do for UK stock and I KNOW it is the best way for me to trade these over longer time frames.

I've gone over old ground here and it may not be what you're after - if not please let me know.

Cheers,
UTB
 
a further thought - have you walk forward tested this in Amibroker - how did it stand up?

Cheers,
UTB
 
Hi Blades,

Thanks for the response. See my comments in BOLD.

Hello Chorlton,

A few observations;

The equity curve and monthly returns look good - very tradeable on the face of it.

It's not clear what your average profit per trade is (I've probably missed it) but note that you should expect to pay spreads of around 1 - 2% for stocks in the FTSE 250. The FTSE is far less liquid than US stock.

Would you suggest I include these spreads when backtesting? ie. Rather than Buy at the Open for example, I would use OPEN plus 0.5 - 1% and for Selling OPEN minus 0.5 - 1%

I'd be really concerned about survivorship bias - as discussed before - I would build a random list of stocks from the FTSE all share (I know you have issues with a complete list, but can you build a substantial list of candidates without issue?)

Firstly, Thanks for the CSV file. Couldn't I simply use ALL the stocks listed in that CSV file as my universe for testing & trading live? Or should I be more selective and if so, what criteria would you suggest I use? I already use a price filter to avoid the "penny shares", which due to their illiquidity have a tendancy to be very unpredictable in terms of price movements

Build a random list of stocks from the data I sent you? If your data provider doesn't support it, use Yahoo. You've touched on issues with yahoo data, so don't trust it outright - but if results drop off significantly, alarm bells should ring at least.

I would look at FTSE250 stocks if not - at least theres 2 ways into this index - up and down. But I'd really try for the other options.

Sorry, probably stupid question, but what do you mean here?

Paper trade your results. Or as suggested, go through collective 2. Costs about $60 for a 6 month listing, I believe. You will get some performance stats, and perhaps interest from others through subs.

A period of actual Paper-Trading is already included in my overall backtesting. To be honest, I hadn't really considered using a dedicated site like Collective2. I was simply going to create a Blog and post results by hand as & when they occur.

I would look to trade more stocks using margin. I would spreadbet these stocks through CMC. I wont enter a debate about the pro's and cons of SB here, but suffice to say it's what I do for UK stock and I KNOW it is the best way for me to trade these over longer time frames.

As you know I was also originally considering using leverage especially given the current low MaxDD of the System. I'm currently subscribed to Finspreads so would welcome your views as to why you have chosen CMC. You can PM me, if you'd rather not enter into that discussion on here. From memory, the list of stocks which Finspreads provides didn't seem to offer the same returns for trading. Not sure why this was the case but further investigation is probably required.

I've gone over old ground here and it may not be what you're after - if not please let me know.

Cheers,
UTB
 
a further thought - have you walk forward tested this in Amibroker - how did it stand up?

Cheers,
UTB

To be honest, I have really explored this function in AB. I would prefer to carry out the forward-testing as an extension to my current testing procedure ie. using AB & TradSim...

I intend to begin the Walk-forward testing over the weekend (time permitting!!) and have been holding off til now, as I can only carry this step out once, so wanted to be happy with the system before starting.

it's suprisingly easy and for the effort gives you a degree of confidence about the way a system has adapted to optimisation in the past. I'm not sure if our wires are crossed, but you can do this as many times as you like, optimising on whatever performance metric you like.

Basicaly it's just chopping your old data into in sample and out of sample, then walking the data periods forwards until present day. The OOS data is then stiched together for comparison with IS results - the less it drops off the better.

Use easy mode and it's simple the click of a button (set in the last tab of settings).

Cheers,
UTB

Hi Blades,

I was referring to the point that once the system is exposed to the "out-of-sample" data it then becomes "in-sample". If any further modifications are then made to the system, then I no longer have any more "out-of-sample" data to validate the system again.

Consequently, I can only perform this task once....

Unless of course I spilt up my "out-of-sample" data in the first place so that there is always a portion left for final validation.

btw. If you get time can you reply back to my questions in bold in post 47.

Thanks bud,

Chorlton
 
Hi Blades,

Thanks for the response. See my comments in BOLD.

Chorlton,

I think you've covered the spreads fine if that's the level you're talking.

I was under the impression that your tests had been on the FTSE100 (from memory) - The only way into this index is if stocks have risen in value - hence survivorship bias issues. The FTSE250 is the NEXT 250 shares, not the biggest - hence includes shares that have fallen (From the FTSE100) or risen (from the small cap) hence less survivorship bias issues (I'm not talking about the risk of shares going bust, just that you might end up testing only stocks that have risen in value by definition). Either way, if you use a random selection of all stocks (as you allude to), not the top indeces, then you only have the issue of missing stocks that have gone bust - so a lesser issue. Live testing will get over this, largely.

I'd choose CMC simply because their spreads are much narrower than Fins (around 0.25% cc 1%). If you want to trade tiddlers, go to IG index. CMC will offer more shares than Fins (from memory). I have accounts with all 3. Your rsults from their offers may be poor because they don't offer small cap stocks.

Collective 2 provides some stats on your system that might be hard to collect otherwise. Really, if you don't want subscribers, it's probably not worth the effort. But given your lack of funding, subs might be an option. You'd need to build a track record to gain these.

re walk forward testing - this is a measure of a system's robustness to optimisation. If your system is continually optimised on a sample and then tests well out of sample - then it suggests you can continue to do this - hence less worries about only having one opportunity to test out of sample.

Cheers,
UTB
 
I agree with Blades. Chorlton, you created this thread in January, meaning you've been working on this system for over six months. At some point, you have to stop tweaking, fix the parameters, and begin trading with current values. Building a history on a blog, as you mentioned, will not be credible, no matter how much explation you have. Also, your blog won't have the pageviews and visibility that trading system sites like collective2 or timertrac garner. From a marketing perspective, your best bet is a reputable 3rd party tracking system. I assume you wouldn't mind the revenue from subscribers.
 
I agree with Blades. Chorlton, you created this thread in January, meaning you've been working on this system for over six months. At some point, you have to stop tweaking, fix the parameters, and begin trading with current values. Building a history on a blog, as you mentioned, will not be credible, no matter how much explation you have. Also, your blog won't have the pageviews and visibility that trading system sites like collective2 or timertrac garner. From a marketing perspective, your best bet is a reputable 3rd party tracking system. I assume you wouldn't mind the revenue from subscribers.

Although I haven't been solely working on my project since Jan, I appreciate the point you are making.

Watch this space.... ;)
 
Top