Walid Salah Eldin's Market Analysis

13th April 2017 - The fear of Trump has started to be materialized on USD and Gold

The gold could extend its rally to be traded now near $1287 per ounce, after last Tuesday surpassing of $1270.50 which stopped it last Friday following the dovish release of Mar US non-farm payrolls which have shown adding only 98k of jobs, while the consensus was referring to gaining 180k.
These are the highest levels of Gold since the Aftermath of Trump's winning of the presidency in US on last Nov. 9 which has been read as good news for Gold "for his aggressive reactions" and bad of the US dollar "for his criticism of its value".
The Gold rose to $1336.33 per ounce following his winning of the presidency, before tumbling to $1122.85 on the reflation optimism and the higher interest rate outlook in US.
The US dollar slide yesterday across the broad came exactly on these same markets expectations, after Trump signaled to Wall Street Journal that it's too strong refraining from naming China currency manipulator.

Monetarily, The Gold could find it easy to record gains versus the greenback, after The FOMC's last meeting minutes of last March have shown serious talking this time about unwinding the Fed's portfolio of treasuries and mortgage backed securities, not just reference to this holding as what has happened in the previous meetings minutes.
The Fed's balance sheet is containing now $4.5 trillion, After 3 Fed's QE rounds for propping up the US economy because of the credit crisis.
As The Fed has kept until now the principal of repurchasing these financial securities it holds on their maturities.
This considered action by the FOMC can give it leeway to slow its hiking of the interest further to be satisfied by tightening the Fed's holding of these financial securities somehow.
As New York Fed President William Dudley said that shrinking the Fed's $4.5 trillion bond portfolio would prompt only a "little pause" in the Fed's rate hike plans keeping market expectation of more than one rate increase this year alive.

But this waited action which can be considered a tightening action can be later looking a must during the Fed's current tightening cycle, but it should be done by a gradual way can be prematurely expected.
While the FOMC's members talking about that crucial subject is still looking to the market participants in a preliminary phase for testing the markets reactions.
The Fed can manage to reverse this twist by lower its Bonds maturities or stopping its reinvestment in the US debt.

After the Fed has made what's named an "Operation Twist" program in late 2011 and 2012 to stimulate the economy by buying longer term Treasuries selling some of its holding of short term treasuries for pressing on the long term treasuries yields in the secondary market.
The operation twist has been taken place in 2 rounds. The first has been from September 2011 till June of 2012 and its value was $400 billion, while The second has been from July 2012 to December 2012 and its value was $267 billion.
The Fed’s now holding $426 billion of Treasuries maturity in 2018 and also $352 billion for 2019.

The US administration has indicated this week that there could be also reaction against the exploding barrels using in Syria against civilians.
While Russia and Iran said in accompanied statement that "US has crossed the Red Line by its illegal military reaction which came without investigation reminding the world by its military attack against Iraq in 2003 for fake chemical weapons existence in Iraq.

The oil prices could be boosted by this tension in the middle east which can threat the supplies from it, while the odds of extending the OPEC's cut was underpinning the prices
After Kuwait and other countries supported prolonging the production cuts that are scheduled to expire in June, as the Persian Gulf emirate’s Oil Minister Issam Almarzooq said.
While the strategy of US in this phase is still the same dampening the prices by overwhelming production, driving its rigs utilization up, raising its inventories up further to new highs.

The far east was not in a better situation, after escalating between US and North Korea, after Trump has indicated in a new message of him on Twitter that "the Chinese help will be appreciated but "US would solve the problem with North Korea with or without China"
His message has already come after US has moved also naval warships from Australia not to Japan sea but to South Korea directly which means that it is taking attacking position.

The US 10 year note yield has fallen yesterday to its lowest level since last Nov. 17 reaching 2.26% on the current lower interest rate outlook and the mounting geopolitical concerns which spurred demand for fixed assets.
The Gold could be more attractive by the current lower yields in the US money market, while the demand for it can continue to be boosted by the risk-off sentiment could gather more momentum this week following Trump's military reactions in the middle east and the far east.

With this dovish market sentiment, the Japanese yen could be the most buoyed currency this week, as this low yield financing currency could be supported by unwinding of the carry trades putting more pressure on Nikkei 225 which is already depressed by the US equities losses.


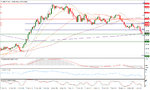
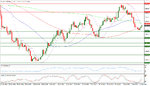
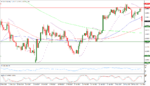
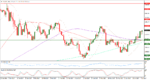
USDJPY has touched in the beginning of today Asian session its daily SMA200 by reaching 108.72
After failing to get back above 110 psychological level to be satisfied by reaching 109.87, whereas it has started to accelerate its slide to the current level.
The pair has already failed to get over its daily SMA20 again by forming a lower high at 111.58 below its peak at 112.20 which has been formed on last Mar. 31.
The pair is now in a closer place to 61.8% Fibonacci retracement of the rise from its bottom which has been formed following Trumps winning of the presidency at 101.21 to 118.67 which has been reached on last Dec.15.
USDJPY is now in its fifth day of being below its daily Parabolic SAR (step 0.02, maximum 0.2) which is reading today 111.83.
USDJPY daily RSI-14 is referring now to existence inside its oversold area below 30 reading 27.597.
USDJPY daily Stochastic Oscillator (5, 3, 3) which is more sensitive to the volatility is having now its main line also in its oversold region below 20 at 2.546 leading to the downside its signal line which is existing in the same region at 18.064.

Important levels: Daily SMA50 @ 112.47, Daily SMA100 @ 113.84 and Daily SMA200 @ 108.75
S&R:
S3: 108.56
S2: 106.03
S3: 101.21
R1: 111.58
R2: 112.20
R3: 113.55

Have a good day
Kind Regards
Global Market Strategist of FX-Recommends
Walid Salah El Din
 

Attachments

  • USDJPY-13-04-2017 05-54-08 ص.jpg
    USDJPY-13-04-2017 05-54-08 ص.jpg
    290 KB · Views: 384
24th April 2017 - Macron's leading could support the single currency

The Centrist Emmanuel Macron leading by 23.87% of the votes could underpin the common currency in the beginning of the week driving it to 1.0908 which is its highest level since last Nov. 11, before setting back for trading currently near 1.0850.
It has been widely expected to watch Macron and Marine Le Pen in the final but Macron leading in this preliminary phase could give the single currency momentum.
What is widely expected now is to see on May 7 runoff a repeated case of what has happened in 2002 to drop down the far-right nationalist radical candidate Marine Le Pen for keeping France core country in EU.

The French presidential results could drive the investors to load risky assets in the beginning of the new week driving the low yielding currencies down such as the Japanese yen to watch USDJPY trading close to 110.50 supporting the Japanese exporters shares in the first Asian session of this week.
The demand for gold as a safe haven has eased down driving it to be traded around $1270 per ounce having its first existence since Apr. 10 above daily Parabolic SAR (step 0.02, maximum 0.2) which is reading today 1295.46.
The yields in the US money market rose also in the beginning of this week giving support to the greenback to watch now US 10yr yield near 2.31%, after it had fallen last week to 2.17% amid risk aversion sentiment.

The market eyes will be closely next on the fiscal situation US which can face a new governmental shutdown, in the case of congress refusing of the Governmental bill by the end of this week.
This is not far away from happening, after the failure of passing Trump's health care bill, while the US government efforts to reach acceptable plans to reform taxes are still on.
U.S. Treasury Secretary Steven Mnuchin has said last week that these plans have progressed supporting the risk appetite.
Mnuchin 's comments could prop S&P 500 up to get back 19.74 points last week, after it had been depressed by energy companies shares slide, as EIA data has shown U.S. gasoline supplies increasing for the first time since February with continued crude output rising.
WTI is still unchanged trading well below $50 per barrel near $49.80, after reaching $49.18 by the end of last week.
Baker Hughes weekly report came by the end of last week to say that US Oil Rigs rose for the 14th consecutive week adding this time 5 rigs to reach 68 which is the highest level since April 2015.

The Markets will be waiting by the end of this week for the flash release of US GDP which is expected show annual growth by 1.5%.
After the Fed's Beige book has underscored last week that "The economy continued to grow across the U.S. at a modest-to-moderate pace in recent weeks without a rapid pickup, as a tight labor market helped broaden wage gains, though consumer spending was mixed.

After forming series of higher lows above 1.0339 which has been reached on the third day of this year to be the lowest level since December 2002, EURUSD could form a second bottom at 1.0681 last Friday.
EURUSD could form an upside gap in the beginning this new week to reach 1.0908 surpassing its previous resistance at 1.0905 which has been formed on last Mar. 27, before diminishing to for currently near 1.0850.
Despite retreating to 1.0850, The pair is still keeping the place it gained above its daily SMA200
EURUSD daily RSI-14 is referring now to existence inside the neutral region reading 65.645.
EURUSD daily Stochastic Oscillator (5, 3, 3) which is more sensitive to the volatility is having now its main line in the neutral region at 71.130 leading to the downside its signal line which is at 73.931, after sliding from 1.0908.
EURUSD is in its eighth day of existence above its daily Parabolic SAR (step 0.02, maximum 0.2) which is reading today 1.0619.

Important levels: Daily SMA50 @ 1.0658, Daily SMA100 @ 1.0622 and Daily SMA200 @ 1.0818
S&R:
S1: 1.0681
S2: 1.0569
S3: 1.0494
R1: 1.0908
R2: 1.0953
R3: 1.0000

Have a good day
Kind Regards
Global Market Strategist of FX-Recommends
Walid Salah El Din
 

Attachments

  • EURUSD-24-04-2017 05-51-34 ص.jpg
    EURUSD-24-04-2017 05-51-34 ص.jpg
    299.2 KB · Views: 325
4th May 2017 - The FOMC could undermine the demand for gold

As expected the FOMC kept the interest rate unchanged between 0.75% and 1% with no change of its $4.5 trillion balance sheet by unanimous decision.
After the lower than expected US GDP annualized expansion in the first quarter of this year which has been by 0.7% attributed to lower consumption.
This reason which can be transitory as the Fed's mentioned has been highlighted in the FOMC members statement with potential hopes for watching upward revision of this reading and also better growth rate later this year.

There was no scheduled press conference of the Fed's chief Yellen following that meeting but the market is to wait for speech from her by the week end following the release of US labor report of April which is to take the markets attention next.
Regarding the inflation forces building up, the Fed's has mentioned today that it is running below but close to its 2% yearly inflation target.
While the unemployment rate in March was at 4.5% which has been its lowest since May 2007, showing meanwhile that the labor market is at the maximum expected capacity by the Fed.

The Fed assured by this way on its gradual pace of tightening and again it did not mention the impact of reflation and also it has not referred to over leveraged rates in the equities market at the current prices levels.
The statement could spark trust in loading risks in the equities market backed by lower interest rate outlook, as it is not expected now to watch more than 2 more rates hikes by 0.25% this year.
The demand for a safe haven setback driving gold to be traded now below $1240 per ounce, while UST 10 years note yield came down by 0.02% to 2.29%.

The gold has been exposed to selloff drove it down below $1239.62 per ounce supporting level which could prop it up previously on Mar. 31 overlapping the price range of the upside wave from $1180.51 to $1263.85 undermining the ascending channel.
XAUUSD is now well below its daily SMA200, after falling below its daily SMA50 but it is still above its daily SMA100 in its ninth day below its daily Parabolic SAR (step 0.02, maximum 0.2) which is reading today $1276.26.
After inability to have a place above its psychological level at $1300, to be satisfied by reaching $1295.46, whereas it has formed a lower high on last April 17 to ease down again to the current levels.
After yesterday increasing of the downside momentum , XAUUSD daily RSI-14 is referring now to existence at a lower place inside its neutral area reading 37.429, after it has been earlier into the overbought area above 70.
XAUUSD daily Stochastic Oscillator (5, 3, 3) which is more sensitive to the volatility is having now also its main line in its oversold region below 20 at 10.051 leading to the downside its signal line which is also in the same territory at 14.291.

Important levels: Daily SMA50 @ $1248.71, Daily SMA100 @ $1220.48 and Daily SMA200 @ $1241.93
S&R:
S1: $1194.91
S2: $1180.51
S3: $1170.83
R1: $1271.11
R2: $1295.78
R3: $1336.67

Have a good day
Kind Regards
Global Market Strategist of FX-Recommends
Walid Salah El Din
 

Attachments

  • xauusd-04-05-2017 01-35-56 ص.jpg
    xauusd-04-05-2017 01-35-56 ص.jpg
    257.6 KB · Views: 172
8th May 2017 - The markets were fully priced in that success by this way

After widely expected winning of Macron, The single currency has been exposed to profit taken following upside opening gap across the broad.
As supporting Macron was the legacy of all other candidate for presidency in France, Macron could easily get presidency by wide gap showing the French will of being in EU.
The gold could easing creep up with the profit taken sentiment to be traded close to $1235 per ounce, after dipping down to 1225 in the beginning of the week.
After reaching 1.1020, EURUSD came under selling off pressure to be traded in the same first Asian session of the week near 1.0970.
The risk appetite which has been boosted by the end of last week by the expected winning of Macron came under pressure after the winning occurrence on buying on rumor selling on fact.
After opening near 113 but below it, USDJPY came under pressure to be traded in the same Asian session near 112.65, as the demand for the low yielding Japanese yen could increase again on unfolding of the risky assets.
As the French presidential results could drive the investors to unwind their previously loaded risky assets following the initial results of the first round in April.
The opening of the EU session is expected to be exposed to the same profit taken wave in the equities markets but the economic optimism can be in check later during the day.

After closing last week at 1.0998, EURUSD opened the new week on an upside gap at 1.1020 but quickly it came under pressure to fill that gap trading currently near 1.0970
EURUSD could form previously an upside gap in beginning of the week opening on last Apr. 24 at 1.0908 but its retreating from it was limited above 1.0820 to keep existence until now above its daily SMA200.
EURUSD is still underpinning by forming series of higher lows above 1.0339 which has been reached on the third day of this year to be the lowest level since December 2002.
EURUSD daily RSI-14 is referring now to existence inside the neutral region reading 65.368.
EURUSD daily Stochastic Oscillator (5, 3, 3) which is more sensitive to the volatility is still having its main line in the overbought region at 86.363 leading to the upside its signal line which is at 80.436 because of the opening gap of the week at 1.1020.
EURUSD is in its eighteenth day of existence above its daily Parabolic SAR (step 0.02, maximum 0.2) which is reading today 1.0874.

Important levels: Daily SMA50 @ 1.0725, Daily SMA100 @ 1.0666 and Daily SMA200 @ 1.0800
S&R:
S1: 1.0820
S2: 1.0681
S3: 1.0569
R1: 1.1020
R2: 1.1299
R3: 1.1366

Have a good day

Kind Regards
Global Market Strategist of FX-Recommends
Walid Salah El Din
 

Attachments

  • EURUSD-Daily.jpg
    EURUSD-Daily.jpg
    271.8 KB · Views: 166
15th May 2017 - The gold is trying to maintain a place again above its daily SMA100

The concerns of watching depleting inflation pressure in US could dampen the interest rate outlook, after Apr US CPI has shown by the end of last week rising yearly by only 2.2%, while the median forecast was referring to increasing by 2.3% after rising in March by 2.4% year on year.
US 10-year Treasury note yield slipped 0.06% to 2.32% last Friday following the release of this figure which makes the Fed in no rush to raise the interest rate to contain the price upside pressure.
The FOMC has already weakened the odds of raising rates by highlighting the lower than expected US GDP annualized expansion in the first quarter by only 0.7% in its economic assessment following the committee members meeting on May. 3.
But The committee has suggested that lower than expected expansion can be transitory expecting upward revision of this dovish reading and also better growth rate later this year underpinned by the labor market continued improving which supports the inflation outlook to reach The Fed's 2% yearly target.
The gold could get use of the lower interest rate outlook in US and also could be boosted by North Korea missile test during the weekend.

After finding bottom to rebound at $1214.23, the Gold could creep up to be traded just above $1230 to find a place again above its daily SMA100, but it is still undermined over longer term by continued existence below its daily its daily SMA200.
XAUUSD is still also below its daily Parabolic SAR (step 0.02, maximum 0.2) which is reading today $1233.55 in its 16th day of being above the trading rate.
The gold has been exposed to selling off drove it down below $1239.62 per ounce supporting level which could prop it up previously on Mar. 31.
the gold lived in overlapping price range of the upside wave from $1180.51 to $1263.85 undermining the ascending channel, but it could hardly have a higher low at $1214.23 above its previous formed bottom at $1194.91 on last Mar. 10.
XAUUSD daily RSI-14 is now referring to existence at a higher place inside its neutral area reading 40.423.
XAUUSD daily Stochastic Oscillator (5, 3, 3) which is more sensitive to the volatility is having now its main line in its neutral region at 64.872 leading to the upside its signal line which is in the same territory at 42.824, after bottoming out inside its oversold region below 20.

Important levels: Daily SMA50 @ $1245.54, Daily SMA100 @ $1226.82 and Daily SMA200 @ $1238.45
S&R:
S1: $1214.23
S2: $1194.91
S3: $1180.51
R1: $1236.85
R2: $1271.11
R3: $1295.78

Have a good day

Kind Regards
Global Market Strategist of FX-Recommends
Walid Salah El Din
 

Attachments

  • XAUUSD-15-05-2017 01-53-24 م.jpg
    XAUUSD-15-05-2017 01-53-24 م.jpg
    259.8 KB · Views: 245
The concerns of watching depleting inflation pressure in US could dampen the interest rate outlook, after Apr US CPI has shown by the end of last week rising yearly by only 2.2%, while the median forecast was referring to increasing by 2.3% after rising in March by 2.4% year on year.
US 10-year Treasury note yield slipped 0.06% to 2.32% last Friday following the release of this figure which makes the Fed in no rush to raise the interest rate to contain the price upside pressure.
The FOMC has already weakened the odds of raising rates by highlighting the lower than expected US GDP annualized expansion in the first quarter by only 0.7% in its economic assessment following the committee members meeting on May. 3.
But The committee has suggested that lower than expected expansion can be transitory expecting upward revision of this dovish reading and also better growth rate later this year underpinned by the labor market continued improving which supports the inflation outlook to reach The Fed's 2% yearly target.
The gold could get use of the lower interest rate outlook in US and also could be boosted by North Korea missile test during the weekend.

After finding bottom to rebound at $1214.23, the Gold could creep up to be traded just above $1230 to find a place again above its daily SMA100, but it is still undermined over longer term by continued existence below its daily its daily SMA200.
XAUUSD is still also below its daily Parabolic SAR (step 0.02, maximum 0.2) which is reading today $1233.55 in its 16th day of being above the trading rate.
The gold has been exposed to selling off drove it down below $1239.62 per ounce supporting level which could prop it up previously on Mar. 31.
the gold lived in overlapping price range of the upside wave from $1180.51 to $1263.85 undermining the ascending channel, but it could hardly have a higher low at $1214.23 above its previous formed bottom at $1194.91 on last Mar. 10.
XAUUSD daily RSI-14 is now referring to existence at a higher place inside its neutral area reading 40.423.
XAUUSD daily Stochastic Oscillator (5, 3, 3) which is more sensitive to the volatility is having now its main line in its neutral region at 64.872 leading to the upside its signal line which is in the same territory at 42.824, after bottoming out inside its oversold region below 20.

Important levels: Daily SMA50 @ $1245.54, Daily SMA100 @ $1226.82 and Daily SMA200 @ $1238.45
S&R:
S1: $1214.23
S2: $1194.91
S3: $1180.51
R1: $1236.85
R2: $1271.11
R3: $1295.78

Have a good day

Kind Regards
Global Market Strategist of FX-Recommends
Walid Salah El Din


are you saying short to 1214 then if it breaks keep going short? i think your chart has way too many levels, was trying to figure out how you came to all of those sup and res levels. i cant tell from your article if you are bullish or bearish
 
1: it has been just due to correction to the upside after selling off to 1214
2: it's still bearish as long as we are below its Daily SMA 200.
3: being below its Daily SMA 100 can lead to increasing of the down side momentum later to re test 1194.91
4; care of that failing to correct further to the upside from here can also show lower rooms to the downside, after steep slide from 1295 dampened the upside momentum.
5: there hasn't been even considerable lower high over the mid term below 1294 peak yet because of this slide showing that the the down side pressure of the mid term is still on taking the lead.
I hope that i could figure out
Have a great day
Kind Regards
Global Market Strategist of FX-Recommends
Walid Salah El Din

I'm short this morning 1234.89

I think I needed to wait for it to go above 1236, potentially test the 50% fib before going short......

I'll hold on for now see how it goes.

However I think price action is telling me short/medium term seems to be bullish, maybe longer term is bearish
 
16th May 2017 - Trump's troubles dampened the greenback

The political ascending tension in US could have its toll on the greenback driving EURUSD to have a higher place above 1.11 during the Asian session.
after it could raise the demand for safe assets, as FBI former remote Director James Comey has said that Trump asked him Comey to drop an investigation into former National Security Advisor Michael Flynn.
Closing the case of Flynn closes as well the investigations about Trump's campaign relation to Russia.
Comey has figured out this point, after released report from the CIA about Trump's sharing of terrorism intelligence classified information with Russia.
Trump became really in a defending situation receiving hits from everywhere, after his decision to fire Comey who has dampened Hillary Clinton campaign by announcing days before the US presidential election that her email usage for sending classified information is still under investigations.
The media in US is keeping amplifying this case adding risk to the political situation in US, as the result of this tension cannot be in the benefit of this situation.
The safe haven assets could aggregate demand again sending XAUUSD above its daily SMA200 again to be traded now close to $1245, after forming a higher bottom at $1214.23 above its previous formed bottom at $1194.91 on last Mar. 10.
With this worrying market sentiment, the Japanese yen could be the most buoyed currency.
As this low yield financing currency could be supported by unwinding of the carry trades as usual putting further pressure on Nikkei 225 major exporting companies.
After S&P 500 lost 1.65 closing at 2400.67 following recording new all times high at 2405.77, while UST 10 years note yield came down by 0.02% to 2.33%


After forming another lower high at 114.36, USDJPY managed to dive below its daily SMA100 again to be traded now near 112.50 in its second day of being below its daily Parabolic SAR (step 0.02, maximum 0.2) which is reading 114.33 today.
USDJPY daily RSI-14 is referring now to existence inside its neutral territory reading 52.283.
USDJPY daily Stochastic Oscillator (5, 3, 3) which is more sensitive to the volatility is having now its main line also in its oversold region below 20 at 19.081 leading to the downside its signal line which is still existing in the neutral region at 39.556.

Important levels: Daily SMA50 @ 111.64, Daily SMA100 @ 112.87 and Daily SMA200 @ 110.24
S&R:
S3: 112.08
S2: 109.58
S3: 108.12
R1: 114.36
R2: 115.49
R3: 117.52

Have a good day

Kind Regards
Global Market Strategist of FX-Recommends
Walid Salah El Din
 

Attachments

  • USDJPY-17-05-2017 05-55-16 ص.jpg
    USDJPY-17-05-2017 05-55-16 ص.jpg
    250.4 KB · Views: 238
22nd May 2017 - Merkel could boost demand for the common currency

Merkel could underpin the single currency in the beginning of this new week by criticizing its strength.
Germany which has been opposing the ECB's QE is now putting more pressure on the ECB, while the economy is improving the inflation is rising up in EU.
Merkel's comments show that it is not preferred to watch the inflation rising up further with no action from ECB which can be in a critical situation.
Her comments which have given reason why the German surplus is rising can be read also as an alarm, After the data have show last week that Germany HICP and CPI of April were up yearly by 2%.
Last December, The ECB has already lowered its QE pace of buying to be Eur 60b monthly, instead of Eur 80b by the end of March, but it has extended this buying program to be till the end of this year by this new pace.
Apr EU CPI was up yearly by 1.9% as the same as the ECB's yearly target which is close but below 2%, while Apr EU core CPI rose by only 1.2% y/y which is its highest rate since June 2013.
The ECB is still explaining the inflation rising up by referring to the energy prices year on year increasing which can be transitory.
WTI average was around $30 in the first quarter of 2016, while the average of the first quarter of this year is around $50 because of implementing OPEC cut deal which is expected to be extended to the end of the first quarter of next year, after this week meeting in Vienna.

From another side, the Fed's steps to raise the interest rate are still making the investment in EU much more attractive option because of the low cost of EUR borrowing comparing with US.
UST 2yr note yield which is sensitive to the interest rate outlook over the short term is now at 1.28%, while Ger 2yr bund yield is at -0.69% showing how the ECB muteness is adding to the interest rate outlook differential
EURUSD has watched intermediate correction into this current ascending wave to 1.1075, before extending its rising to 1.1262 which has been reached earlier today.
EURUSD has previously made limited correction to 1.0838 on profit taking, after reaching 1.1020 following Macron's winning which dampened the political concerns in EU, while the political concerns in US are still rising.
EURUSD could succeed to keep existence above its daily SMA200 since its opening gap following the first round of the French elections
Before having this current rising up momentum, EURUSD could be underpinned by forming series of higher lows above 1.0339 which has been reached on the third day of this year to be the lowest level since December 2002.
EURUSD daily RSI-14 is referring now to existence inside the overbought region above 70 reading 72.509.
EURUSD daily Stochastic Oscillator (5, 3, 3) which is more sensitive to the volatility is still having its main line in the overbought region above 80 at 88.510 below its signal line which is at 90.236, but with no cutting leading to the downward yet.
EURUSD is in its fifth day of existence above its daily Parabolic SAR (step 0.02, maximum 0.2) which is reading today 1.0902.

Important levels: Daily SMA50 @ 1.0814, Daily SMA100 @ 1.0722 and Daily SMA200 @ 1.0792
S&R:
S1: 1.1075
S2: 1.0838
S3: 1.0681
R1: 1.1299
R2: 1.1366
R3: 1.1428

Have a good day

Kind Regards
Global Market Strategist of FX-Recommends
Walid Salah El Din
 

Attachments

  • EURUSD-22-05-2017 07-06-28 م.jpg
    EURUSD-22-05-2017 07-06-28 م.jpg
    305.4 KB · Views: 303
Soo should I click on buy or sell button? It's been too vague sorry, no precise recommendations or at least bias presented. Basically its useless cuz there is not conclusion.
 
2nd June 2017 - The risk appetite could be boosted by lower odds of raising rates in

US Blue chips could come back to the green territory to overcome the depression following the dovish release of May US Labor report which has shown adding only 138k of jobs out of the farming sector, while the median forecast was pointing to increasing by 185k.
But May labor report has shown again lower unemployment rate to reach only 4.3% to be at its lowest level in the last 16 years.
The report has shown average earning per hour rising yearly by 2.5% in May as the same as April, while the consensus was referring to increasing by 2.6% showing that there is no serious need to contain the wages inflationary pressure.
UST 10YR yield lost 4 points by falling to 2.17% following this shocking release which came after yesterday May ADP report which has shown adding 253k, while the market was waiting for 185k to prepare the market for strong labor data to be released today.
The gold is still keeping its gains following this release to be traded until now close to $1275 per ounce.
The greenback has been undermined across the broad because of this release which lowered the prospects of having another interest rate hiking when the FOMC to meet later on 13th and 14th this month.
USDJPY has dived to be traded now near 110 losing about 100 pips, despite the rebound of the risk appetite which has been boosted by lower probability of raising rates in US.

USDJPY is now well below its daily SMA200, after falling below its daily SMA50, with continued existence below its daily SMA100
USDJPY is now in its 14th day of being below its daily Parabolic SAR (step 0.02, maximum 0.2) which is reading 112.23 today, after forming a peak at 114.36 has been followed by a lower high at 112.12.
USDJPY daily RSI-14 is referring now to existence inside its neutral territory reading 41.513.
USDJPY daily Stochastic Oscillator (5, 3, 3) which is more sensitive to the volatility is having now its main line inside its neutral region at 30.682 above its signal line which is also in the neutral region at 27.188

Important levels: Daily SMA50 @ 111.19, Daily SMA100 @ 112.26 and Daily SMA200 @ 110.77
S&R:
S3: 110.23
S2: 109.58
S3: 108.12
R1: 112.12
R2: 114.36
R3: 115.49

Have a good day
Kind Regards
Global Market Strategist of FX-Recommends
Walid Salah El Din
 

Attachments

  • USD-JPY-02-06-2017 05-51-17 م.png
    USD-JPY-02-06-2017 05-51-17 م.png
    35.2 KB · Views: 207
9th June 2017 - The political risks undermined the British pound

The parliamentary election could contain the market the sentiment by the weekend putting pressure on the cable after adding political risks to the Brexit negotiations.
As the elections ended to Conservative losing of 12 seats having only 318 seats, while the labor party could gain 31 seats raising its share to 261 seats.
Treresa May who was looking for stronger support in the Brexit negotiations is now exposed to have shorter time in office, after this election which is expected to direct the new government structure to diversity for having majority.
The pound has been dampened by this new mixed situation, before the Brexit negotiations which are now looking harder.
While the data which came out today from UK have shown lower than expected industrial and manufacturing productions in April.
FTSEE 100 could be boosted by this lower GBP exchange rate which is boosting the British exporters returns.
The sentiment in the European session was generally bullish, after yesterday ECB president Mario Draghi signaled yesterday that EU has not generated yet enough inflation to move The ECB, despite the current bullish economic outlook improving after EU GDP yearly growth by 1.9% in the first quarter of this year.
WTI could rebound to $45.85 per barrel, after falling to $45.19 on unexpected rising of US EIA crude oil inventory by 3.295m barrels to 513.207m in the week ending on Jun. 2, while the market was waiting for falling by 3.464m barrels.
UST 10YR rose by 0.02% more to 2.21% supporting the greenback which could be underpinned versus its rival for another session by the interest rate outlook differential amid rising odds of having another interest rate hiking when the FOMC to meet later on 13th and 14th of this month.

The cable came under increasing downside pressure, after forming lower high at 1.2976 below its formed peak at 1.3047 on last May. 18.
After watching today a downside gap, The Cable extended its slippage to 1.2636 before rebounding for trading currently near 1.2735 below its daily SMA50 but it's still above its daily SMA100 and its daily SMA200.
The cable is trading again below its daily Parabolic SAR (step 0.02, maximum 0.2) which is reading 1.2976 today.
GBPUSD daily RSI-14 is referring now to existence in a lower place inside its neutral territory reading 38.659.
GBPUSD daily Stochastic Oscillator (5, 3, 3) which is more sensitive to the volatility is having now its main line inside its neutral region at 53.442 keeping its leading to the downside its signal line which is also in the neutral region at 72.087

Important levels: Daily SMA50 @ 1.2804, Daily SMA100 @ 1.2617 and Daily SMA200 @ 1.2522
S&R:
S1: 1.2636
S2: 1.2364
S3: 1.2108
R1: 1.2976
R2: 1.3047
R3: 1.3118

Have a good day
Kind Regards
Global Market Strategist of FX-Recommends
Walid Salah El Din
 

Attachments

  • GBPUSD-09-06-2017 04-12-43 م.png
    GBPUSD-09-06-2017 04-12-43 م.png
    34.5 KB · Views: 173
15th June 2017 - Is the turn now on BOC to raise the interest rate?

The market will be waiting today for BOE amid the current political tensions in UK which is watching rising of the inflationary pressure but with lower GDP growth rate.
The MPC decision is expected to keep the interest rate and its APP unchanged, after The FOMC members could overcome yesterday their declared worries about the weak inflation forces in US and decided to raise the Fed fund rate by another 0.25% to be between 1% and 1.25% as widely expected.
The decision came by majority as Minneapolis Fed President Neel Kashkari refused to raise the interest rate again.
The committee members maintained their median expectation of having another 0.25% hiking by the end of this year, before raising it by 0.75% more next year lowering their median forecast of the interest rate to be at 2.9% by the end of 2019 from 3% they projected last march.
The committee expected the inflation rate to continue to be in the short run below its 2% yearly inflation target, before stabilizing around this rate over the medium term as it targets.
So, The committees expected the inflation rate to be at 1.6% this year down from 1.9% it's expected in March, but it kept its forecast for 2018 and 2018 at 2% yearly as the same as its median term inflation target expecting the GDP annualized growth rate to be by 2.2% this year from 2.1% it expected in March.

Fed Chair Janet Yellen has said in her scheduled press conference following the meeting that the Fed is closely watching the inflation developments, while the risks facing the US economy are looking roughly balanced.
Yellen indicated that if the economy is to continue to evolve in its expected course, The unwinding plan of its balances sheet will take effect relatively soon.
After the committee mentioned in its statement that it is currently expecting to begin implementing a balance sheet normalization program this year, as the economy evolves broadly as anticipated.

After preparing the market for this action in the previous meeting, The committee set this meeting its unwinding plan details for normalizing its balance sheet but without determining of the starting date of this action.
The Fed announced that the initial cap will be set at $10 billion a month "$6 billion from Treasuries and $4 billion from mortgage-backed securities", before rising every three months by this same scale until the caps reach $30 billion of US treasuries and $20 billion of MBS.

After this action, the turn is now looking at BOC to follow The Fed not at BOE as what has been expected previously before the Brexit.
After BOC senior deputy governor Wilkins surprised the markets earlier this week by her comment that the economic growth continues to broaden by ideally and there will be assessing of all placed stimulus measurement to see, if they are still needed.
Her comment could prop up the Lonnie across the broad, despite the oil prices easing down recently which usually weighs down on it.
USDCAD stabilized to be traded close to 1.3250 in the recent hours following the Fed's decision, after its slide reaching of 1.3164 from 1.3539 whereas it had been before Wilkins's comments.

After falling extension to 1.3164, USDCAD could find support to bounce up for trading now near 1.3150.
But it's still well below its daily SMA50, its daily SMA100 and its daily SMA200, after this second impulsive wave to the downside which has been formed this week.
USDCAD is now in its fifth day of being below its daily Parabolic SAR (step 0.02, maximum 0.2) which is reading 1.3491 today, after topping at 1.3539 below its previous peak which has been formed at 1.3547 on this Jun. 2.
After bottoming out at 1.3164, USDCAD daily RSI-14 is still referring to existence inside its oversold territory below 30 reading 29.385.
USDCAD daily Stochastic Oscillator (5, 3, 3) which is more sensitive to the volatility is still having also its main line inside its oversold region below 20 at 17.556 leading to the upside its signal line which is at 13.743

Important levels: Daily SMA50 @ 1.2804, Daily SMA100 @ 1.2617 and Daily SMA200 @ 1.2522
S&R:
S1: 1.2636
S2: 1.2364
S3: 1.2108
R1: 1.2976
R2: 1.3047
R3: 1.3118

Have a good day
Kind Regards
Global Market Strategist of FX-Recommends
Walid Salah El Din
 

Attachments

  • USDCAD-15-06-2017 09-15-32 ص.png
    USDCAD-15-06-2017 09-15-32 ص.png
    32.5 KB · Views: 202
Did market follow your analysis?

I just see that there can be leeway for loonie appreciation by God's will, on higher interest outlook in Canada, after wilkens's statements which refer to less need of the current stimulus placed measurements
Have a good day and take care
 
23rd June 2017 - The Canadian dollar could be boosted by the oil prices recovery

USDCAD is now hovering around 1.3220 right ahead of key inflation data to be released from Canada today, after it could be boosted by the oil prices recovery yesterday.
WTI is still trading close to $43 per barrel, after footing just above $42 per barrel.
WTI depreciation to that level could tackle the demand for loonies, as the Canadian economy depends on exporting commodities and crude oil especially to US.
While BOC is still expected to be the closest major central bank to follow the Fed in raising rates
After BOC senior deputy governor Wilkins surprised the markets earlier last week by her comment that the economic growth continues to broaden by ideally and there will be assessing of all placed stimulus measurement to see, if they are still needed.
Her comment could put pressure on USDCAD sending it down to 1.3164 from 1.3539 whereas it had been before Wilkins's comments.

After falling extension to 1.3164, USDCAD could find support to creep up to 1.3347 before retreating again the current level.
After facing difficulty to be above its daily SMA200 again while it is still keeping its current existence well below its daily SMA50, its daily SMA100, after topping at 1.3539 below its previous peak which has been formed at 1.3547 on this Jun. 2.
USDCAD is now in its eleventh day of being below its daily Parabolic SAR (step 0.02, maximum 0.2) which is reading 1.3362 today.
USDCAD daily RSI-14 is still referring to existence inside its neutral territory, after fixing its oversold stance reading 35.859.
USDCAD daily Stochastic Oscillator (5, 3, 3) which is more sensitive to the volatility is still having also its main line inside its neutral region at 44.878 leading to the downside its signal line which is at 57.323

Important levels: Daily SMA50 @ 1.3494, Daily SMA100 @ 1.3392 and Daily SMA200 @ 1.3338
S&R:
S1: 1.3164
S2: 1.3051
S3: 1.3009
R1: 1.3347
R2: 1.3547
R3: 1.3669

Have a good day

Kind Regards
Global Market Strategist of FX-Recommends
Walid Salah El Din
 

Attachments

  • USDCAD.png
    USDCAD.png
    32.7 KB · Views: 278
27th June 2017 - USDCAD 1.3200 supporting area can be in check

The greenback is looking depressed ahead of the release of important US inflation data by the end of this week, While the market are waiting today for Yellen's speech from London looking for new clues of the US monetary policy.
After The FOMC members maintained their median expectation of having another 0.25% hiking by the end of this year.
The committee underscored its appreciation of the current inflation pressure easing down in its released assessment.
The committee expected the inflation rate to continue to be in the short run below its 2% yearly inflation target, before stabilizing around this rate over the medium term as it targets.
The committees expected the inflation rate to be at 1.6% this year down from 1.9% it's expected in March, but it kept its forecast for 2018 and 2018 at 2% yearly as the same as its median term inflation target expecting the GDP annualized growth rate to be by 2.2% this year from 2.1% it expected in March.

So, the release of Apr US PCE which is the Fed's favorite gauge of inflation is expected to take much of the market attention by the end of this week, after it had shown rising by only 1.7% yearly in March.
While US GDP final figure of the first quarter is expected to show next Thursday annualized growth by 1.2% as the same as the second reading, after the shocking preliminary reading of it had shown previously growth by only 0.7%.

UST 10 YR yield is now well below 2.15% at 2.13%, while EURUSD managed to stand well above 1.12 this morning, after The ECB president Draghi had said today that the economic growth in EU is broadening but the prudence in adjusting the monetary policy is still needed.

The sentiment in the European session is not running well, after EU Commission imposing of $2.7b fine against Google and following campaigned slide of equities in HK market during the Asian session.
While the markets in the American session is expected to be undermined by charging the Brazilian president Tamer with corruption exposing Brazil to further political instability.

CAD is now underpinned by the oil prices rebound too, after it had been already boosted by rising odds of having sooner than later increasing of the borrowing costs in Canada.
After BOC senior deputy governor Wilkins's previous comment that the economic growth continues to broaden by ideally and there will be assessing of all placed stimulus measurement to see, if they are still needed.
USDCAD 1.3200 supporting area can be in check with persisting of this current market sentiment, while WTI is close but below $44 per barrel ahead of US EIA crude oil inventory release of the week ending on Jun. 23 tomorrow.

Have a good day
Kind Regards
Global Market Strategist of FX-Recommends
Walid Salah El Din
 
3rd July 2017 - The interest rate outlook changes dominate the Forex market

The greenback is still depressed versus GBP, EUR and loonies, After last week comments from BOE, ECB and BOC chiefs who have signaled shifting towards tighter monetary policy raising the costs of borrowing significantly last week in the secondary markets.

As The ECB president Draghi has boosted demand from the single currency last week by his comments that the economic growth in EU is broadening but the prudence in adjusting the monetary policy is still needed, while the inflation risks have become to the upside not to the downside.

GBPUSD soared too to be traded above 1.30 psychological level, after Mark Carney commented that the BOE may be in need to begin raising interest rate soon.
BOE’s MPC members have voted in their last meeting on last Jun. 15 5-3 to leave the interest rate unchanged showing lower tolerance of watching the inflation level above its 2% yearly inflation target.

Bank of Canada Governor Stephen Poloz indicated too in a CNBC interview last week that interest rate cuts have done their job and that levels are now looking extraordinarily low.
his comments pushed USDCAD down to be traded well below 1.30, while the markets participants are waiting now for BOC to be the first major central bank to follow the Fed's tightening steps by starting raising the interest rate in its next meeting on Jul. 12 by 0.25%.
Poloz indicated that Canada major regions had watched strong growth but this growth likely to slow moderately in the upcoming quarters.
He said that the Fed is now two years ahead of Canada because of the recent oil price shock that forced the Bank to cut rates to that levels.
While the most recent surveys of BOC has shown that the Canadian business leaders have now the strongest outlook since 2011 reaching 2.81 from 0.73 in the previous quarter.
BOC’s quarterly Business Outlook Survey of summer 2017 has shown last Friday evolving economic activities in Canada broadly with improving of the inflation outlook and higher trust in hiring.

From another side, The inflation figures which came out from US last Friday have highlighted lower pressure on the Fed to raise rates.
As April PCE broad figure and core figure also rose by only 1.4% year on year while the Fed's target over the medium term is 2% yearly.
The PCE is the Fed's Favorite inflation barometer and The committee underscored its appreciation of the current inflation pressure easing down in its released assessment.
The committee expected the inflation rate to continue to be in the short run below its 2% yearly inflation target, before stabilizing around this rate over the medium term as it targets.
The committees expected the inflation rate to be at 1.6% this year down from 1.9% it's expected in March, but it kept its forecast for 2018 and 2018 at 2% yearly.

While monetary policy stance in Japan is still looking unchanged weighing down in the Japanese yen by its BOJ''s ultra easing policy which targets raising the inflation to 2% yearly meanwhile by keeping the governmental bonds yields too at the current low level close to zero.
After driving down the interest rate to -0.1% on Jan. 29, 201 to work be beside its QE which has started to expand by yen 80tr yearly since Oct. 31, 2014.
BOJ's members have refrained from sending any signal of tightening its policy showing that there is no probability of watching this step as long as there is no reaching of the 2 yearly target and as long as they are in office.
Last Friday release of Japan National CPI ex fresh foods which is the favorite gauge of inflation to BOJ has shown rising yearly by only 0.4% as expected which has been the highest scale of rising since March 2015 a year after implementing raising the sales taxes by 3% to 8% in the beginning of April 2014 which could add to the inflation annual rate about 1.7%, before diminishing with the release of April 2015 inflation rates.
The Japanese PM Abe has delayed the next 2% rising of the sale tax 2.5 years, instead of raising it with the beginning of the current financial year to support the economy.
Abe LDP ruling party is looking ahead of having a stronger than expected failure in Tokyo elections which can put many positions in his cabinet in check.
The major governmental bonds yields could score last week exceptional progress but JGB which are still unchanged making the Japanese yen less attractive.

USDJPY is still keeping existence well below its daily SMA50, its daily SMA100 and also its daily SMA200
USDJPY is now in its 13th day of being below its daily Parabolic SAR (step 0.02, maximum 0.2) which is reading 111.20 today, after forming a higher low on last Jun. 14 at 108.81 above its bottom at 108.13 which has been formed on last Apr.17.
USDJPY daily RSI-14 is referring now to existence inside its neutral territory reading 62.481.
USDJPY daily Stochastic Oscillator (5, 3, 3) which is more sensitive to the volatility is having now its main line inside its neutral region at 66.673 leading to the downside its signal line which is also in the neutral region at 72.594.

Important levels: Daily SMA50 @ 111.59, Daily SMA100 @ 111.77 and Daily SMA200 @ 111.15
S&R:
S3: 110.95
S2: 108.81
S3: 108.13
R1: 112.92
R2: 114.36
R3: 115.62


Have a good day
Kind Regards
Global Market Strategist of FX-Recommends
Walid Salah El Din
 

Attachments

  • USDJPY-03-07-2017 07-06-43 ص.png
    USDJPY-03-07-2017 07-06-43 ص.png
    32.3 KB · Views: 190
5th July 2017 - The yen weakness is still underpinning the Japanese equities

The demand for safe haven eased down this morning waiting for US opening, after yesterday closing because of the independence day.
The market participants will be curious to see the outcome of the G20 Meeting in Hamburg, after the North Korean ICBM test which could spur demand for safe haven instrument yesterday.
The gold came down to be traded again near $1220 per ounce and USDJPY rose to be traded close to 113.50 helping the Japanese equities to recover, after weighing on them by its declining to 112.73 following the North Korean ICBM.

While the monetary policy unchanged stance of BOJ is still weighing down on the Japanese yen, with no signal yet from BOJ of changing its ultra easing policy.
BOJ targets raising the inflation to 2% yearly meanwhile by keeping the governmental bonds yields at the current low level close to zero.
After driving down the interest rate to -0.1% on Jan. 29, 201 to work be beside its QE which has started to expand by yen 80tr yearly since Oct. 31, 2014.
BOJ's members have refrained from sending any signal of tightening its policy showing that there is no probability of watching this step as long as there is no reaching of the 2 yearly target and as long as they are in office.
Last Friday release of Japan National CPI ex fresh foods which is the favorite gauge of inflation to BOJ has shown rising yearly by only 0.4% as expected which has been the highest scale of rising since March 2015 a year after implementing raising the sales taxes by 3% to 8% in the beginning of April 2014 which could add to the inflation annual rate about 1.7%, before diminishing with the release of April 2015 inflation rates.

After receiving signals of shifting towards tighter monetary policy in EU, UK and Canada, the major governmental bonds yields across the globe could score exceptional progress last week but JGB h are still unchanged making the Japanese yen less attractive.
JGB 10YR yield is still close to 0.05%, while US 10YR yield could gain 0.16% to rise to 2.33% last week boosted by Yellen's assurance on the gradual path of tightening continuation in US.
While the markets will be waiting today for the release of the FOMC recent meeting minute of last June 15 when it raised the Fed fund rate by another 0.25% to be between 1% and 1.25% as widely expected expecting another tightening by 0.25% by the end of this year.

The FOMC committee underscored its appreciation of the current inflation pressure easing down in its released assessment following that meeting.
The committee expected the inflation rate to continue to be in the short run below its 2% yearly inflation target, before stabilizing around this rate over the medium term as it targets.
The committee expected the inflation rate to be at 1.6% this year down from 1.9% it's expected in March, but it kept its forecast for 2018 and 2018 at 2% yearly.
April US PCE broad figure and also core figure rose by only 1.4% year on year, while the Fed's target over the medium term is 2% yearly. The PCE is the Fed's Favorite inflation barometer.

USDJPY could gain momentum to be traded now at a higher place above its daily SMA50, its daily SMA100 and also its daily SMA200
USDJPY is now in its 15th day of being above its daily Parabolic SAR (step 0.02, maximum 0.2) which is reading 111.87 today, after forming a higher low on last Jun. 14 at 108.81 above its bottom at 108.13 which has been formed on last Apr.17.
USDJPY daily RSI-14 is still referring to existence inside its neutral territory but at a closer place to its overbought territory above 70 reading now 68.833.
USDJPY daily Stochastic Oscillator (5, 3, 3) which is more sensitive to the volatility is having now its main line inside its overbought region above 80 at 93.674 leading to the upside its signal line which is lower in the same region at 84.716.

Important levels: Daily SMA50 @ 111.70, Daily SMA100 @ 111.76 and Daily SMA200 @ 111.28
S&R:
S3: 111.73
S2: 110.95
S3: 108.81
R1: 114.63
R2: 115.62
R3: 117.53

Have a good day
Kind Regards
Global Market Strategist of FX-Recommends
Walid Salah El Din
 

Attachments

  • USDJPY-05-07-2017 12-07-51 م.png
    USDJPY-05-07-2017 12-07-51 م.png
    32 KB · Views: 207
Top