Walid Salah Eldin's Market Analysis

BOJ's decision drove the US future equities indexes up

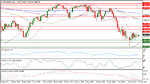
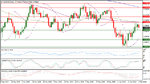
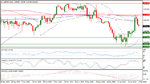
SP-MAR16 could be boosted during the Asian session by BOJ's decision to rise to 1902.75, while the risk appetite has been already boosted yesterday by retreating of US Initial Jobless Claims in the week ending on Jan. 22 to 278k and the consensus was referring to retreating to 282k from 293k in the week ending on Jan. 15, despite the shocking release of Dec durable goods orders which decreased by 5.1% monthly, while the consensus was referring to -0.6% only, after declining by 0.5% in November.

SP-Mar16 daily RSI is reading now 41.028 in its neutral region coming from its oversold area below 30 and also its daily Stochastic Oscillator (5, 3, 3) which is more sensitive to the volatility is having now its main line into the neutral region reading 57.480 and also its signal line which is reading now 64.886

SP-Mar16 daily Parabolic SAR (step 0.02, maximum 0.2) is referring today to 1825.03 in its sixth day of being below the trading rate, after rising extension last Friday too reached 1902.


Important levels: Daily SMA50 @ 1997.55, Daily SMA100 @ 2002.00 and Daily SMA200 @ 2037.23

S&R:

S1: 1851.25
S2: 1836.25
S3: 1804.25
R1: 1909.75
R2: 1927.25
R3: 1946.25


Have a good day

Walid Salah El din
Chief Tech Analyst of Trade-24
 

Attachments

  • SP Mar . 16 Daily 29-01-2016 07-06-42 ?.jpg
    SP Mar . 16 Daily 29-01-2016 07-06-42 ?.jpg
    201.8 KB · Views: 188
The trendline resistance extension from 1.3992 to 1.1712 dropped EURUSD again

EURUSD has faced difficulty again to be above the trendline resistance extension from 1.3992 to 1.1712.

EURUSD which is trading close to 1.0850 is in meeting now with its daily SMA50, after failing to have a place above its daily SMA100.

The pair parameters are still referring to balanced situation having its daily RSI-14 in the neutral region reading now 47.727 and also its daily Stochastic Oscillator (5, 3, 3) which is more sensitive to the volatility is having now its main line in the neutral region reading 47.185 leading to the downside its signal line which is reading now 58.662.

The pair is now in its day number 12 of continued existence above its daily Parabolic SAR (step 0.02, maximum 0.2) which is reading today 1.0763.

Important levels: Daily SMA50 @ 1.0849, Daily SMA100 @ 1.0967 and Daily SMA200 @ 1.1053

S&R:

S1: 1.0776
S2: 1.0709
S3: 1.0519
R1: 1.0991
R2: 1.1058
R3: 1.1098

Have a good day

Walid Salah El din
Chief Tech Analyst of Trade-24
 

Attachments

  • EURUSD Daily 01-02-2016 06-57-21 ص.jpg
    EURUSD Daily 01-02-2016 06-57-21 ص.jpg
    215.6 KB · Views: 218
USDJPY is now in meeting with its daily SMA200

USDJPY surpassed its daily SMA50 and daily SMA100 to reside now for trading close to its daily SMA200 near 121.20, after the volatility which has been triggered by BOJ's decision to imply negative interest rate.

USDJPY rose to 121.40 directly following the decision, before retreating again to 119.11, whereas it managed to go with the new market discounting creeping up to 121.67 by the end of last week with improving of the risk appetite in the equities market mainly because of the oil prices extended rebound.

USDJPY daily Parabolic SAR (step 0.02, maximum 0.2) is reading now 116.68 in its seventh day of continued being below the trading rate.

USDJPY daily RSI is referring now to existence in the neutral region reading now 64.980, while its daily Stochastic Oscillator (5, 3, 3) which is more sensitive to the volatility is having now its main line in the overbought area above 80 reading 86.565 and also its signal line which is reading now 85.306.


Important levels: Daily SMA50 @ 120.33, Daily SMA100 @ 120.61 and Daily SMA200 @ 121.48

S&R:

S1: 118.48
S2: 117.64
S3: 116.45
R1: 121.67
R2: 123.74
R3: 124.61

Have a good day

Walid Salah El din
Chief Tech Analyst of Trade-24
 

Attachments

  • USDJPY Daily 01-02-2016 06-21-56 ص.jpg
    USDJPY Daily 01-02-2016 06-21-56 ص.jpg
    180 KB · Views: 188
The oil rebound could fuel the risk appetite, despite the US economic deceleration

The oil benchmarks can find it harder meanwhile to stabilize again below 30$ which is looking the price that could exercise the oil exporters patience.
The oil prices could be boosted by seen tries from OPEC members and non-OPEC members oil exporters to reach a compromise for cutting their productions.
From another side, Baker Hughes weekly report came to say that US Oil Rigs have fallen by another 12 to 498, after operating 1223 a year ago.
EIA said also last Friday in its monthly report that the US productions came down to 9.317m daily in November from 9.370m in October. The oil prices in November were well above 40$. So, this number can go severely down with January prices. From another side, the prospects of keeping the interest rate unchanged in US for longer time could support the energy and the commodities prices, after the preliminary release of US Q4 GDP had shown last Friday annual growth by only 0.7%, while the consensus was referring to 0.8%, after expansion by 2% in the third quarter and 3.9% in the second quarter of last year.
This GDP expansion deceleration pace can lead to contraction in this Q1 with the current harsh winter like what has happened in 2014 and 2015.
This weaker than expected figure of 2015 Q4 came after the FOMC had clarified earlier last week that it is in waiting and see stance for assessing the global economic slowdown and the financial development implications for the labor market, the inflation, and for the balance of risks to the outlook.
It is important today to wait for Jan Manufacturing PMI data from EU, UK figures and also US ISM Manufacturing index which is expected to make progress, after Jan Chicago Manufacturing PMI came by the end of last week to show rebounding to 55.6 from 42.9 in December.
CL Mar. 16 is now trading near $33, after extending its rebound from $27.55 to $34.81 which has been reached following breaking its previous resisting level at $32.80 which dragged the mixture down to form a higher low at $29.25.

CL Mar. 16 which is still well above its daily SMA20 is in its sixth consecutive day of being above its Parabolic SAR (step 0.02, maximum 0.2) which is reading today 28.76.

CL Mar 16 daily RSI-14 is referring now to existence in its neutral area reading 48.669 and also its daily Stochastic Oscillator (5, 3, 3) which is more sensitive to the volatility is having now its main line in the neutral region reading 75.959 with its signal line which is referring to 77.354 coming from the overbought area above 80, after facing resistance at $34.81.

Important levels: Daily SMA20 @ $32.10, Daily SMA50 @ $36.06, Daily SMA100 @ $40.763 and Daily SMA200 @ $46.96.

S&R:

S1: $29.25
S2: $27.55
S3: $26.93
R1: $34.81
R2: $35.57
R3: $38.37


Have a good day

Walid Salah El din
Chief Tech Analyst of Trade-24
 

Attachments

  • CL Mar. 16 Daily 01-02-2016 06-38-06 ص.jpg
    CL Mar. 16 Daily 01-02-2016 06-38-06 ص.jpg
    200.1 KB · Views: 188
Glenn keeps the door opened for more easing steps

The RBA's decision which usually comes on the first Tuesday of each month has been followed by statement from RBA's Chief Governor Glenn Stevens saying that the global economy is continuing to grow but at slightly slower pace than earlier expected causing pressure on commodities and energy prices making it appropriate for monetary policy to continue to be accommodative.

His comments left the door opened for more easing steps to be taken and did not also give higher appreciation of the inflation which rose by 1.7% yearly in the fourth quarter of last year saying that was partly caused by declining prices for oil and some utilities, but underlying measures of inflation are also low at about 2%, with growth in labor costs continuing to be quite subdued as well, and inflation restrained elsewhere in the world, consumer price inflation is likely to remain low over the next year or two.


AUDUSD could rise in the beginning of today Asian session supported by the improvement in the Chinese equities market to be traded near 0.7120 but it came under pressure to fall to 0.7081, after the RBA's decision to maintain the interest rate unchanged as it has been since last May. 5 at 2%.

AUDUSD daily Parabolic SAR (step 0.02, maximum 0.2) is now its ninth day of being below the trading rate reading today 0.6934.

AUDUSD daily RSI-14 is referring now to existence in its neutral area reading now 51.261 and also its daily Stochastic Oscillator (5, 3, 3) which is more sensitive to the volatility is having its main line now in the neutral region but close to the overbought area above 80 reading now 73.936 and also its signal line which is referring to 76.697, after failing to get over 0.7139


Important levels: Daily SMA50 @ 0.7141, Daily SMA100 @ 0.7145 and Daily SMA200 @ 0.7333

S&R:

S1: 0.7040
S2: 0.6916
S3: 0.6825
R1: 0.7139
R2: 0.7212
R3: 0.7359


Have a good day

Walid Salah El din
Chief Tech Analyst of Trade-24
 

Attachments

  • AUDUSD Daily 02-02-2016 06-15-57 ص.jpg
    AUDUSD Daily 02-02-2016 06-15-57 ص.jpg
    187.2 KB · Views: 193
Fischer's comments dragged SP-MAR16 down below 1920

Following Fischer's comments which highlighted the Fed's worries and uncertainty, SP-MAR16 came under pressure to fall below 1920, after facing difficulty to get higher than 1940 yesterday.

SP-Mar16 daily RSI is reading now 47.638 in its neutral region, while its daily Stochastic Oscillator (5, 3, 3) which is more sensitive to the volatility is having now its main line into the overbought area above 80 reading 85.510, while its signal line is still unable to enter the overbought area to continue to be in the neutral region but close to the overbought area reading now 78.737.

SP-Mar16 daily Parabolic SAR (step 0.02, maximum 0.2) is referring today to 1844.24 in its eighth day of being below the trading rate, after rising extension last Friday reached 1902 on last Jan. 22.


Important levels: Daily SMA50 @ 1991.85, Daily SMA100 @ 2001.71 and Daily SMA200 @ 2035.55

S&R:

S1: 1864.50
S2: 1851.25
S3: 1836.25
R1: 1946.25
R2: 1964.50
R3: 2016.50


Have a good day

Walid Salah El din
Chief Tech Analyst of Trade-24
 

Attachments

  • SP Mar. 16 Daily 02-02-2016 07-08-16 ص.jpg
    SP Mar. 16 Daily 02-02-2016 07-08-16 ص.jpg
    195.7 KB · Views: 196
The gold is in serious meeting with its daily SMA200

Despite the mixed closing of the US major stocks indexes, Shanghai composite could make remarkable progress in the beginning of today session, after news about PBOC injection of 50b Yuan for 14 day reverse repo and 50b Yuan for 28 day reverse repo setting USDCNY today down to 6.5510 from 6.5783 yesterday.

Jan US ISM came yesterday unchanged in the contraction territory below 50 at 48.2 as it has been in December versus 48 expected.

US PCE which is the Fed's favorite gauge of inflation rose by 0.6% year on year in December, after increasing by 0.5% in November with no monthly change of US consumer spending figure which accounts for 70% of US GDP versus 0.1% expected, after soaring by 0.5% in November, while the personal income rose by 0.3% in December as the same as November versus 0.2% expected.

The Fed's vice president Stanley Fischer said after the session that the next Fed's step is still unclear amid the global uncertainty adding that it is too difficult to gauge the impact on the U.S. economy from recent turmoil in financial markets and uncertainty over China.

His comments supported the Gold further and lowered the future rates of S&P 500, as they assured the Fed's worries and also uncertainty which can delay the next Fed's tightening step.

The FOMC has already indicated last week the current need for waiting and see for assessing the global economic slowdown and the financial development implications for the labor market, the inflation, and for the balance of risks to the outlook.

The gold kept its creeping up to reach $1130.23 supported by lower interest rate outlook in US to be in important meeting now with it daily SMA200.

The gold could gather momentum, after getting over its daily SMA100 following surpassing $1112.75 which capped it on last Nov. 4.

$1071.22 could help the gold previously to bounce up again above its daily SMA50 forming a floor at $1057.98 which drove the gold to start being above its daily Parabolic SAR (step 0.02, maximum 0.2) for 22 consecutive days reading today $1106.56.

XAUUSD daily RSI-14 is referring now to existence in its neutral area reading 63.515, while its daily Stochastic Oscillator (5, 3, 3) which is more sensitive to the volatility is having now its main line in the neutral region but close to the overbought area above 80 reading 78.521 and leading its signal line which is reading now 74.802.


Important levels: Daily SMA50 @ $1082.33, Daily SMA100 @ $1106.11 and Daily SMA200 @ $1130.91

S&R:

S1: $1108.26
S2: $1071.22
S3: $1057.98
R1: $1138.05
R2: $1149.84
R3: $1162.45

Have a good day

Walid Salah El din
Chief Tech Analyst of Trade-24
 

Attachments

  • XAUUSD Daily 02-02-2016 06-50-29 ص.jpg
    XAUUSD Daily 02-02-2016 06-50-29 ص.jpg
    193 KB · Views: 235
The cable resided again for trading near 1.44

GBPUSD is still trying to keep trading near 1.44, after the National Institute for Economic and Social Research said that it is expecting 0.3% annual inflation rate in UK down from 1.1% it has expected earlier last November.

NIESR sees no expected chance for raising the interest rate in UK, before the ‘Brexit’ Referendum but it said that the interest rate can go higher later to reach 1.5% by the end of next year with GDP expected expansion by 2.3% in 2016 and 2.7% in 2017.

After dipping down to 1.4324 yesterday, The cable returned to be traded near 1.44 keeping its existence above its daily Parabolic SAR (step 0.02, maximum 0.2) which is reading today 1.4183 in its ninth day in a row of being below the trading rate.

The cable daily RSI-14 is now in the neutral territory reading 46.561, while its daily Stochastic Oscillator (5, 3, 3) which is more sensitive to the volatility is having now its main line in overbought area above 80 reading 90.515, while its signal line is still keeping existence in the neutral region but close to the overbought area reading now 78.942.

The cable yesterday bottoming out at 1.4324 kept its existence above its hourly SMA200, its hourly SMA100 and its hourly SMA500 but it is still in a relatively deep place below its daily SMA50, its daily SMA100 and its daily SMA200 showing continued pressure on the it over the longer term.

Important levels: Daily SMA50 @ 1.4716, Daily SMA100 @ 1.5002 and Daily SMA200 @ 1.5260

S&R:

S1: 1.4324
S2: 1.4171
S3: 1.4078
R1: 1.4474
R2: 1.4643
R3: 1.4723


Have a good day

Walid Salah El din
Chief Tech Analyst of Trade-24
 

Attachments

  • GBPUSD Daily 03-02-2016 06-07-43 ص.jpg
    GBPUSD Daily 03-02-2016 06-07-43 ص.jpg
    206.2 KB · Views: 208
The oil slide brought back the pressure on USDJPY

With the oil prices slide again, The US major stocks indexes came under increased down side pressure yesterday, after it had been tempered by The Fed's Vice President Stanley Fischer's comments that it is too difficult to gauge the impact on the U.S. economy from the recent turmoil in financial markets and the uncertainty over China.

The risk aversion could bring USDJPY back below 120, after it had been boosted to reach 121.67 by BOJ's surprising decision to lower the interest rate to -0.1% to work with its monetary base expansion by 80 trillion yen annually for achieving the 2% price stability yearly target at the earliest possible time.

The risk-off sentiment could boost demand for the Japanese yen, as this low cost financing currency usually gains benefits during the dovish market sentiment.

USDJPY which has peaked out at 121.67 has fallen again below its daily SMA200, daily SMA100 and daily SMA50.

USDJPY is now trading near 119.60 keeping existence above its daily Parabolic SAR (step 0.02, maximum 0.2) which is reading today 117.26 in its ninth day of continued being below the trading rate.

USDJPY daily RSI is referring now to existence in the neutral region reading now 52.639 and also its daily Stochastic Oscillator (5, 3, 3) which is more sensitive to the volatility is having its main line in the neutral area coming from the overbought area above 80 to read now 59.112 leading to the downside its signal line which is reading now 72.526.

Important levels: Daily SMA50 @ 120.21, Daily SMA100 @ 120.60 and Daily SMA200 @ 121.49

S&R:

S1: 118.48
S2: 117.64
S3: 116.45
R1: 121.67
R2: 123.74
R3: 124.61


Have a good day

Walid Salah El din
Chief Tech Analyst of Trade-24
 

Attachments

  • USDJPY Daily 03-02-2016 04-56-18 ص.jpg
    USDJPY Daily 03-02-2016 04-56-18 ص.jpg
    178.5 KB · Views: 162
EIA crude stockpile surpassing 0.5b barrels may have bad psychological impact

After last week rebound which has been extended to $36.75, Brent Apr. 16 came again under pressure this week to be traded now near $32.50.

Brent Apr. 16 which is still keeping existence until now above its daily SMA20 is still above its daily Parabolic SAR (step 0.02, maximum 0.2) is referring today to $30.56 in its ninth consecutive day of being below the trading rate.

Brent Apr. 16 daily RSI is now in the neutral region reading 45.898 and also its daily Stochastic Oscillator (5, 3, 3) which is more sensitive to the volatility is having now its main line in neutral area but close to the oversold area below 20 reading 31.901 and leading its signal line which is in a higher place in the neutral region reading now 55.491.

Brent Apr. 16 which has been unfazed of US EIA Oil stockpile growing in the week ending on Jan. 22 to 494,920m by gaining 8.383m barrels is waiting today for the crude inventory figure of the week ending on Jan.29 to be up by 4.733m, while surpassing 0.5b barrels may have bad psychological impact on the oil prices.

Important levels: Daily SMA20 @ $31.77, Daily SMA50 @ $36.57, Daily SMA100 @ $42.40 and Daily SMA200 @ $50.16

S&R:

S1: $30.12
S2: $29.28
S3: $27.10
R1: $36.75
R2: $39.68
R3: $41.56


Have a good day

Walid Salah El din
Chief Tech Analyst of Trade-24
 

Attachments

  • Brent Apr. 16 Daily 03-02-2016 05-23-34 ص.jpg
    Brent Apr. 16 Daily 03-02-2016 05-23-34 ص.jpg
    194.5 KB · Views: 210
Depressed oil prices brought down equities in the U.S. and U.K. markets. Due to the turmoil, investors seemed to prefer safe-haven government bonds.
In the oil market, there is a massive supply glut. A deal between oil-producing countries fell through. The crude slide has been prolonged and this has seen to it that shares have plunged in the big oil majors like Exxon Mobil and BP.
The oil price slide has been seen as a sign of trouble in the global economy. The marketplace has been rather nervous. The bottom is yet to be found with regards to oil prices.

anyway meanwhile, trading below 30$ is in need for more reasons now to prove that there is no conviction among the exporters inside the OPEC and outside of it for cutting production.
that's about the supply.

About the demand, the market is in need to watch frozen economy in US this harsh winter to know that there are increasing worries about the demand too, if not the oil prices can find higher leeway to rebound.
as the US economic expansion acceleration can give confidence in other lower economies too and bring back an atmosphere of trust in the global economy.

Have a good day
Take Care
 
The golden crucial crossing of Daily SMA200

The gold has been exposed to profit taken following the release of Jan US labor report which has shown lower unemployment rate at 4.9% but with adding of only 151k of jobs out of the farming sector.
The Gold has been boosted earlier this week, after Fed's vice president Stanley Fischer could add uncertainty to the markets about the interest rate outlook in US by saying that the next of the step Fed is still unclear amid the global uncertainty.
He said it clearly that it is too difficult to gauge the impact on the U.S. economy from recent turmoil in financial markets and uncertainty over China, after the FOMC said last week that it is assessing currently the global economic slowdown and the financial development implications for the labor market, the inflation, and for the balance of risks to the outlook.
His comments underpinned the Gold and caused problem to the greenback generally versus its rival currencies which have been depressed by the Fed's first hiking interest rate decision since 2006 by the end of last year.
The gold could gain momentum this week following getting over its daily SMA200. The gold gathering of this momentum started following surpassing its daily SMA100 which came accompanied with getting over surpassing $1112.75 which capped it on last Nov. 4.
$1071.22 could help the gold previously to bounce up again above its daily SMA50 forming a floor at $1057.98 which drove the gold to start being above its daily Parabolic SAR (step 0.02, maximum 0.2) for 25 consecutive days reading today $1124.17.
XAUUSD daily RSI-14 is referring now to existence in the neutral region just below its overbought area above 70 reading now 69.666, while its daily Stochastic Oscillator (5, 3, 3) which is more sensitive to the volatility is still having now its main line in its overbought area above 80 reading 86.200 below its signal line which is reading now 90.506.
After this rising acceleration by God's will, the next resisting level can be at $1163.09 which stopped it today, before $1182.68 peak which came last Oct. 28 below its highest level since Jun. 25 at $1191.33.
While the setting back can face now supporting level at $1108.26, before $1100 psychological level which can be followed by $1071.22.

Have a good day

Kind Regards
Walid Salah El Din
Global Market Strategist of FX-Recommends
 

Attachments

  • XAUUSD daily 05-02-2016 04-01-14 ?.jpg
    XAUUSD daily 05-02-2016 04-01-14 ?.jpg
    209.9 KB · Views: 184
Last edited:
The gold has been exposed to profit taken following the release of Jan US labor report which has shown lower unemployment rate at 4.9% but with adding of only 151k of jobs out of the farming sector.
The Gold has been boosted earlier this week, after Fed's vice president Stanley Fischer could add uncertainty to the markets about the interest rate outlook in US by saying that the next of the step Fed is still unclear amid the global uncertainty.
He said it clearly that it is too difficult to gauge the impact on the U.S. economy from recent turmoil in financial markets and uncertainty over China, after the FOMC said last week that it is assessing currently the global economic slowdown and the financial development implications for the labor market, the inflation, and for the balance of risks to the outlook.
His comments underpinned the Gold and caused problem to the greenback generally versus its rival currencies which have been depressed by the Fed's first hiking interest rate decision since 2006 by the end of last year.
The gold could gain momentum this week following getting over its daily SMA200. The gold gathering of this momentum started following surpassing its daily SMA100 which came accompanied with getting over surpassing $1112.75 which capped it on last Nov. 4.
$1071.22 could help the gold previously to bounce up again above its daily SMA50 forming a floor at $1057.98 which drove the gold to start being above its daily Parabolic SAR (step 0.02, maximum 0.2) for 25 consecutive days reading today $1124.17.
XAUUSD daily RSI-14 is referring now to existence in the neutral region just below its overbought area above 70 reading now 69.666, while its daily Stochastic Oscillator (5, 3, 3) which is more sensitive to the volatility is still having now its main line in its overbought area above 80 reading 86.200 below its signal line which is reading now 90.506.
After this rising acceleration by God's will, the next resisting level can be at $1163.09 which stopped it today, before $1182.68 peak which came last Oct. 28 below its highest level since Jun. 25 at $1191.33.
While the setting back can face now supporting level at $1108.26, before $1100 psychological level which can be followed by $1071.22.

so you are effectively saying that gold goes down due economic or more fiscal related information, yet goes up due to God?
 
only profit taken following the news which did not add to the greenback dovish sentiment but lowered the worries about the unemployment rate in US.
 
In my opinion, the next levels to watch for are: support - 1.4224, resistance - 1.4670.

GBPUSD.jpg
 
Top