vwap - Formula

TheBramble

Legendary member
Messages
8,394
Likes
1,170
Grey1 posted a formula for calculating the upper/lower vwap bands

"1) Deduct LOW from the HIGH of the day
2) divide this by 2.... we call this Maximum permissible deviation or MPD for simplicity ..."


...but what is the formula (TS/Metastock - whatever) for calculating the vwap itself?
 
See this link for Investor RT from which you may be able to translate into others - this is a general indicator weighted average and should be applied to volume in this instance
http://www.linnsoft.com/tour/techind/iwa.htm

Alternatively you may wish to look at value area indicator and try to program that
http://www.linnsoft.com/tour/techind/va.htm

(Have to say this one's a pig Ok if your into means etc)

Plus a crib sheet on Formula tokens
http://www.linnsoft.com/tour/techind/forumla.htm

Hope this helps as I have no TS knowledge
Ron
 
Last edited:
Tony,

Are you asking what the basic formula is or what the code is to display it in TS ?

The basic formula is:

VWAP = price x volume/ Total Volume

and this is for every price traded during the day. Some people calculate it by taking the average price per minute x volume / Total Volume


Paul
 
I was after ANY formula on the basis I could work it round to what I needed so thanks all.

However, to display on ANY charting package, presumably you have a seperate axis for the vwap, so how do you combine with the price to show their relative positions?

If VWAP = price X vol / Total Vol then the VWAP is going to be A LOT less (value wise) than the current price...?
 
I am not a statitstician so it is best for Grey1 to answer but as price can and does deviate from vwap both up and down then this cannot be quite how it works.


Paul
 
What I meant Paul, is that apart from the first bar (regardless of your timeframe) where last vol = total vol (for the day), from then on, the last vol / total vol is going to be getting smaller and smaller.

Multiply that by the price and the vwap is going to be getting smaller and smaller.

That's why I asked for a physical indicator (any package) formula as I couldn't see how the vwap could be plotted on the same Y-axis as the price.

I understand the basis of the vwap calculation - just not how it can be plotted in the same window as price.
 
TheBramble,

You need to do price x volume for every single trade of the day so far, sum the total and then divide that by total volume.

Can't write the actual formula properly as not sure how on a computer but as a crappy form where p=price of trade and volume=volume of trade:

((p1*v1)+(p2*v2)+...+(pn*vn)) / totalvol = VWAP

Makes it very hard to program in unless it is embedded I expect, hence why people would approximate it to:

((a1*v1)+(a2*v2)+...+(an*vn)) / totalvol = VWAP

where a1 is H+L/2 for the first minute bar and v1 is total volume in the first minute bar and so on up to the nth minute bar.

wysi
 
Thanks wysi. And that raises an interesting point.

If it's each actual trade vol and trade price, any charting package which works with OHLC data over a fixed timespan (be 1 min, 5 min whatever) is going to be off by a bit.

Presumably, it isn't generally significant?
 
Surely the ultimate VWAP line is a line where 50% of the days traded volume is above the line and 50% below it ?

In order to do this even semi correctly you'd have to use a chart of 1 min closes and compile the VWAP exactly as wysinawyg has indicated.

It would therefore make an interesting study to then compare the 'fast VWAP' value with the value calculated from the 1 min chart.

Steve.

Of course the only way to get a 100% correct VWAP would be to use tick charts.
 
There is no noticeable difference between time interval and the vwap price. Also if 50% of the days volume was above a set line and 50% below it by a fixed amount then the VWAP would be at the set line as it is a weighted average. The vwap line is essentially the price at which most of the days volume has been traded.


Paul
 
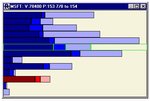
Another way to look at VWAP is through volume profile. VWAP is the longest line on the VP histogram
 

Attachments

  • volumeprofile.jpg
    volumeprofile.jpg
    23.4 KB · Views: 120
"The vwap line is essentially the price at which most of the days volume has been traded." - I must be missing something here. Surely that is more like market profile's 'point of control' ??

Steve.
 
I was under the impression that VWAP was the total number of dollars traded (in all transactions) divided by total number of shares traded. Therefore, in order to calculate the 'total number of dollars traded' the volumes at all prices have to be considered.

Steve.
 
SS
Talking through my hat - again - sorry - fired it off without thinking - all prices and all volume are included. Fair to say though that there is probably a bell curve distribution by and large though :-(
 
Yes they do but the vwap price is "weighted" by the average volume at that price (from my understanding). I am sure we could discuss this further but I would wait for Grey1 to come back and give a much fuller answer.


Paul
 
As some of you may have guessed, I'm a lot more intuitive than technical, HOWEVER I would love to embed into excel, a formula that shows when the actual price of a Uk equity is trading by more or less than 5% away from it's VWAP ( I use proquote for my price feeds) can anyone creat a simple formula? preferably that changes the cell red if it's 5% below, and blue if it's 5% above?
 
Does proquote have a direct feed link that works is Excel ?
If so does proquote have vwap as a quoted figure ?


Paul
 
Take a look at these - you may find some help there
http://www.willowsolutions.com/tips/tips.shtml
http://www.mrexcel.com/pc07.shtml
http://www.beyondtechnology.com/tips016.shtml
join yahoo xtraders and look at the boards or ask there

You need a feed/charting app that is dde compliant - I believe sharescope RT has vwap and is dde'able

Linnsoft IRT would do it

you will need to create dynamic ranges in excel to accomodate varying numbers of stocks


The last part of the task will be to use conditional formatting in your display columns to show red/blue etc
what market are you wanting
 
Are all you guys using Trade Station? I'd like to take a more active part in this forum but having difficulty in setting up my charts with the upper and lower VWAP.

I have Sierra, but there is no pre defined VWAP, although I guess it may be possible to write your own dde. I've posted an appeal for help on their "yahoo users group" but had no response. Also no response from a similar request on the Sierra thread on T2W.

I'm also trialling QT with money.net as a feed. QT has VWAP as a standard indicator, but I can't see how you can set up an upper and lower VWAP band.

Is anyone else experiencing a similar problem, or am I uniquely dense!? Answers on a postcard please :)
 
Roger,

This is already available in QT certainly on the latest version but it does need some setting up.

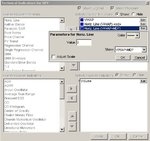
First you need to right click on a chart and select indicators and from that select VWAP and then add another indicator called "Horiz Line" but add it twice, (one for upper and one for lower vwap bands).

You can then edit one "Horiz Line" to show +MPD and edit the other to show -MPD


I hope this helps


Paul
 

Attachments

  • qt & vwap.jpg
    qt & vwap.jpg
    50.1 KB · Views: 115
Top