Tradestation Codes

rajibde

Well-known member
Messages
295
Likes
9
Hi All,

Before I start off, just to introduce myself- I've started trading for close to a year now. Initially started off with spread betting and typically like many I experienced a roller coaster ride while trying to experiment various strategies-but managed to keep my losses to as small as possible while I am experimenting (in terms of the bet amounts). I have learnt a lot from the strategies discussed in this BB especially after closely following Grey1's advice .

I am now in a transition stage from spread betting to the actual trading and am trying to use the tradestation for analysis and ease of decision making.

I have found and tried to absorb extensive discussions of Grey1's strategy in relation to the VWAP engine, Exhaustion Engine and the Risk engine but could not find much on the codes for the functions which can be entered in the TS to enable me to properly use the strategies and hence I decided to start this thread with a view to get your help.

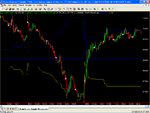
On the VWAP- the code which I 've found in the this BB is as follows-

vars:
PriceW(0),
ShareW(0),
Answer(0);

if date > date[1] then begin
PriceW = 0;
ShareW = 0;
end;

PriceW = PriceW + (AvgPrice * (UpTicks+DownTicks));
ShareW = ShareW + (UpTicks+DownTicks);

if ShareW > 0 then
Answer = PriceW / ShareW;

VWAP_H = Answer;


now create an indicator "VWAP"


Quote:
inputs:
UpColor(Red),
DownColor(Blue);

vars:
Answer(0);

Answer = VWAP_H;

if AvgPrice >= Answer then
SetPlotColor(1,DownColor)
else
SetPlotColor(1,UpColor);

Plot1(Answer,"VWAP");


This code passes the verification test on the TS - Could someone pl. comment on this code if this is comprehensive?

Edit- missed this one- the mpd bands can be calculated as (the days high -days low)/2
VWAP +mpd and VWAP -MPD (just remembered these from Grey1's earlier posts).


Reading the materials posted by Grey1 on risk management based on volatility stops I think 2 risk bands can be plotted on the chart to give an indication of the stops -the function can be-

(max share value in the last 14 days incl the current day +min value in this period) /2 ='X'

now the stop bands can be 'X' + 'Y' and 'X' -'Y' where Y is a function of the capital which can be risked on a trade as the case may be for the individual.
It would be easier for me to fit the function in an excel but trying to code it for TS........ :(


At this stage I do not have an idea as to how to go about the Exhaustion engine (MACCIs)- any help there please?

Pl. feel free to give constructive comments.

Best wishes.

Raj
 
Last edited:
Sorry Rajibde - didn't mean to abandon you.

Your VWAP_H function and the indicator look ok. Your view on the MPD bands is correct as I understand it. You could add that in to the indicator you already have to plot upper and lower bands.

As to your 'X' and 'Y' and 14 days etc - I don't quite understand what you're saying. I don't recognise them from Grey1s posts but there are a lot of Grey1 posts so I might well have missed it. Perhaps give an example of what you're suggesting

Regards,
Gareth
 
garethb said:
Sorry Rajibde - didn't mean to abandon you.

Your VWAP_H function and the indicator look ok. Your view on the MPD bands is correct as I understand it. You could add that in to the indicator you already have to plot upper and lower bands.

As to your 'X' and 'Y' and 14 days etc - I don't quite understand what you're saying. I don't recognise them from Grey1s posts but there are a lot of Grey1 posts so I might well have missed it. Perhaps give an example of what you're suggesting

Regards,
Gareth

Hi Gareth,

Thank you very much for the reply. The idea of the volatility stops (X & Y) came from one of the doc which Grey1 had attached in his post some time ago. In short- the theory was to place a stop based on the the average volatility of the stock over the past few days (14 for e.g.). for eg. if the the price of a stock in the last 14 days has been at an average of $10 and the average of the lows has been $8 and that for the high $12 over this period. then the stops can be placed an amount 'Y' away from these values (based on the type of entry-long/short). The value $10 was the X which I'd mentioned. I hope this is a bit more clear.
However, re-reading the way the MPD bands may be used I am now of the opinion that the MPD bands itself give a good indication of where to place the stops (pl. correct me if I'm wrong)

Regards
Raj
 
In short- the theory was to place a stop based on the the average volatility of the stock over the past few days (14 for e.g.).

This only applies if you are trading EOD. The idea is to take the ATR over 14 periods of any timeframe that you may trade so if you are tarding a 1min chart then you would take the ATR over 14 mins etc.


Paul
 
Trader333 said:
This only applies if you are trading EOD. The idea is to take the ATR over 14 periods of any timeframe that you may trade so if you are tarding a 1min chart then you would take the ATR over 14 mins etc.


Paul

Thanks Paul. If in a pair trading an entry is made when the price goes back through the mpd band then in this case would the mpd band itself help in deciding the stop?
 
rajibde said:
Thanks Paul. If in a pair trading an entry is made when the price goes back through the mpd band then in this case would the mpd band itself help in deciding the stop?

If the price break above MPD band you donot stop loss as you have to watch your hedged postion at the same time . You will stop loss if your net postion runs into negative by 1ATR . That is ,, if you are using a 1 min time frame and the stock's ATR is 20 C then you stop loss by 20C. Remember you must have a NET stop loss and not just one of the pairs .

Is that clear ?

Grey1
 
Grey1 said:
If the price break above MPD band you donot stop loss as you have to watch your hedged postion at the same time . You will stop loss if your net postion runs into negative by 1ATR . That is ,, if you are using a 1 min time frame and the stock's ATR is 20 C then you stop loss by 20C. Remember you must have a NET stop loss and not just one of the pairs .

Is that clear ?

Grey1

Thanks Grey1 -it is clear now.
 
e-reading the way the MPD bands may be used I am now of the opinion that the MPD bands itself give a good indication of where to place the stops (pl. correct me if I'm wrong)

Hi, i'd disagree. in my humble opinion, MPD gives a good estimation of a MORE SAFE ENTRY POINT, i.e it has more edge if u trade near MPD, rather than near VWAP(central) line, and this is because of the mechanism of block trading, which is a MM's concern. i mean i don't think it's a good idea to use MPD bands for selecting where to put the stop. if the trade been selected good enough, there's low probability of S/L hitting, the core of Grey1's strat is selecting the trades which has Best potential in them.
for S/L, a fraction of ATR(14) in any given TF would be good, it gives a probablity edge, not to be stopped out with Noises equal to average of recent candle lengths.

1. find best pair trade candidates(short candidate first) by exhaustion engine(be in a safe place of a cycle)
2. check if it's near enough to Upper/Lower MPD(edge in entry)
3. when Both 1 AND 2 are satisfied, trade the pair against each other

i'd be more than pleased if any1 could correct me, in case my thoughts above are faulty.

Regards
.......................................
Kako
 
kako said:
Hi, i'd disagree. in my humble opinion, MPD gives a good estimation of a MORE SAFE ENTRY POINT, i.e it has more edge if u trade near MPD, rather than near VWAP(central) line, and this is because of the mechanism of block trading, which is a MM's concern. i mean i don't think it's a good idea to use MPD bands for selecting where to put the stop. if the trade been selected good enough, there's low probability of S/L hitting, the core of Grey1's strat is selecting the trades which has Best potential in them.
for S/L, a fraction of ATR(14) in any given TF would be good, it gives a probablity edge, not to be stopped out with Noises equal to average of recent candle lengths.

1. find best pair trade candidates(short candidate first) by exhaustion engine(be in a safe place of a cycle)
2. check if it's near enough to Upper/Lower MPD(edge in entry)
3. when Both 1 AND 2 are satisfied, trade the pair against each other

i'd be more than pleased if any1 could correct me, in case my thoughts above are faulty.

Regards
.......................................
Kako

Hi Kako,

Thanks for your reply- yes I quite agree to what you've said -the question was the stop placement in relation to the mpd bands and that has been clarified by Grey1 and Paul's replies. I could find the code for making a CCI function, I'll have to study the easylanguage to see if I can smooth it to be able to plot MACCI for the exhaustion engine.... :?:

Regards

Raj
 
Trader333 said:
If you ask Grey1 he will send you the code for the exhaustion engine


Paul

Hi Grey1

Pleeeeeeeeeeeeeeeeeeeease can you share with me the exhaustion engine code ?

Regards

Raj
 
This is the CCI Code in the easylanguage which I've found from the TS library-


INPUTS: LENGTH(20), CCILONG(100), CCISHORT(-100);

PLOT1(CCI(LENGTH), "CCI");
PLOT2(CCILONG, "CCILONG");
PLOT3(CCISHORT, "CCISHORT");

{ALERT CRITERIA}
IF PLOT1 > PLOT2 THEN
ALERT("CCI IS IN OVERBOUGHT TERRITORY")
ELSE
IF PLOT1 < PLOT3 THEN
ALERT("CCI IS IN OVERSOLD TERRITORY");

IF PLOT1 CROSSES OVER 0 THEN
ALERT("CCI HAS CROSSED OVER ZERO")
ELSE
IF PLOT1 CROSSES UNDER 0 THEN
ALERT("CCI HAS CROSSED UNDER ZERO");


How does the MA fit into the code?
 
Hi Paul,

Thanks -I have now included the MPD code into the VWAP and it shows the mpd bands now. Thank you very much for your help. The VWAP line however, is central to the screen and this seems to be a bit odd + it only seems to show the band + the VWAP when the 5min bars are selected for the symbol (attach 1); if the symbol is then opted with 1 min bar then the VWAP goes all over the screen + bands disappears (attach 2)- any suggestions please?

Cheers!

Raj
 

Attachments

  • untitled.PNG
    untitled.PNG
    50.9 KB · Views: 57
  • untitled2.PNG
    untitled2.PNG
    46.1 KB · Views: 43
rajibde said:
Hi Paul,

Thanks -I have now included the MPD code into the VWAP and it shows the mpd bands now. Thank you very much for your help. The VWAP line however, is central to the screen and this seems to be a bit odd + it only seems to show the band + the VWAP when the 5min bars are selected for the symbol (attach 1); if the symbol is then opted with 1 min bar then the VWAP goes all over the screen + bands disappears (attach 2)- any suggestions please?

Cheers!

Raj

I should have tried this before sending the last post- well for anyone who has a similar problem- the problem (of the disappearing MPD bands) got resolved when I selected the 'days back' in the format symbol page to a higher figure (in this case to 20). I guess I'll have to live with the VWAP line being a straight line as opposed to one which curves....

Peace at last-Ican go to sleep now! :)
 

Attachments

  • untitled3.PNG
    untitled3.PNG
    56.8 KB · Views: 49
Raj,

This doesnt look right, I am wondering if your original VWAP code is correct ? I am out for most of the day so wont get a chance to answer until possibly Saturday.


Paul
 
Raj

try these:
1- change the setting to "trade volime"
2- change the time to "exchange timezone" ( i have this option in settings window, but from ur screenshot seems u don't, i'm afraid we use different versions)
3- play with "scaling" option, try screen
4- right click on indicator(MPD) and change the scaling(it's different from chart's scaling) to "same as symbol"

HTH
 
Rajbde

I agree with paul - your charts don't look right. Do you want to post your code up again for us to take a look

Regards

Gareth
 
kako said:
Raj

try these:
1- change the setting to "trade volime"
2- change the time to "exchange timezone" ( i have this option in settings window, but from ur screenshot seems u don't, i'm afraid we use different versions)
3- play with "scaling" option, try screen
4- right click on indicator(MPD) and change the scaling(it's different from chart's scaling) to "same as symbol"

HTH

Hi Kako,

Thanks for your reply-

1- change the setting to "trade volume"

I've selected this now

4- right click on indicator(MPD) and change the scaling(it's different from chart's scaling) to "same as symbol"

I've right clicked the VWAP (MPD is part of the VWAP code in my EL) and have selected 'same as symbol'

I have now attached the screen print -pl. let me know if this looks OK.

Cheers

Raj
 

Attachments

  • untitled.PNG
    untitled.PNG
    44.4 KB · Views: 62
garethb said:
Rajbde

I agree with paul - your charts don't look right. Do you want to post your code up again for us to take a look

Regards

Gareth

Hi Gareth,

The code including the MPD bands is as follows-

In functions-
vars:
PriceW(0),
ShareW(0),
Answer(0);

if date > date[1] then begin
PriceW = 0;
ShareW = 0;
end;

PriceW = PriceW + (AvgPrice * (UpTicks+DownTicks));
ShareW = ShareW + (UpTicks+DownTicks);

if ShareW > 0 then
Answer = PriceW / ShareW;

VWAP_H = Answer;


In indicator-

inputs:
UpColor(Red),
DownColor(Blue);

vars:
Answer(0),
U_MPD (0),
L_MPD (0);

Answer = VWAP_H;
U_MPD = VWAP_H + ((highD(0)-lowD(0))/2);
L_MPD = VWAP_H - ((highD(0)-lowD(0))/2);

if AvgPrice >= Answer then
SetPlotColor(1,DownColor)
else
SetPlotColor(1,UpColor);

Plot1(Answer,"VWAP");
Plot2 (U_MPD,"Upper");
Plot3 (L_MPD,"Lower");


Regards

Raj
 
Top