Using Moving Averages
If you are new to the site and are new to Technical analysis the following is an ideal start. This is a simple buying strategy based on Moving Averages. It is often where most TA ( technical analysis ) users start.
If you need help you only have to ask either me or any of the folks in the trade to win chat room. We all want to make sure that your ability to learn and earn is as smooth as possible.
To start with use this strategy under the following rules,
1. Only trade ftse100 stocks
2. Only trade stocks with high volume
3. Only trade stocks that have low spreads
The aim is to make 5%. In a relatively short term ( a month )
I suggest you operate a 5% stop loss.( and impose it strictly )
Here's the strategy,
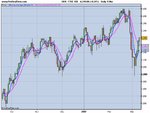
Use 5day and 10day moving averages, watch for an upward trend of both the MAs and the stocks price.
Buy if the stock price is above the MAs and when the 5DAY MA moves up through the 10DAY MA. Remember all 3 must be in an upward trend.
I use 5 and 10 as this is a short term strategy but you can use longer MAs for long trading ranges. EG 10 and 20 for 2 months or 50 and 100 for say 6 month strategy.
Its very easy to use but also very effective. But the best is you can do this for free on most charting www sites.
This is one strategy that can be used. There are loads of different approaches.
I suggest that anyone who reads this or any strategy on BBs trys it out themselves in PAPER ONLY. Do not risk your money till you are happy with the system. Ensure you are happy with it and it suits your style of trading.
Ok i'll try to post up the crossover report that i have created from the AIQ system every week. ( hopefully on friday nights so you get the weekend to have a good look )
It shows ( or will ) those stocks that in the last 5 days have crossed MAs ( the 5 day over the 10 day ) These are only ftse100 stocks and only those that do over 300k per day vol.
The other things to bear in mind with this report are the following,
Trend Score and Delta Trend Score
AIQ’s two special trend indicators, Trend Score and Delta Trend Score, appear on all group and sector reports. These indicators are explained below.
Trend Score (TS)
Trend Score is an extremely useful indication of the overall technical strength or weakness of each group or sector. It is derived from six technical indicators (MACD, Directional Movement, ADXR, Positive Volume, Volume Accumulation, and On Balance Volume). Trend Score is designed to give a quantitative measure of the current trend of these indicators.
A special expert system computes the Trend Score from the values of the six indicators. The indicators are all trend-following and the expert system consists entirely of trend-following rules. Trend Score values are similar to Expert Ratings in that they range between plus and minus 100, with large positive values indicating an uptrend and large negative values a downtrend.
Delta Trend Score (DTS)
Delta Trend Score measures the rate of change in the Trend Score from the previous day’s value. A large DTS value can be an indication of significant change and is often an early sign of improving technical conditions.
Don't forget to look for the TS and DTS for the group that the stock belongs to.
This strategy is not meant as financial advice and as always anyone using this or any other advice do so at their own risk. It is also the posting of a private investor and therefore not the advice of TRADE2WIN.CO.UK.
Good luck
Sefty
If you are new to the site and are new to Technical analysis the following is an ideal start. This is a simple buying strategy based on Moving Averages. It is often where most TA ( technical analysis ) users start.
If you need help you only have to ask either me or any of the folks in the trade to win chat room. We all want to make sure that your ability to learn and earn is as smooth as possible.
To start with use this strategy under the following rules,
1. Only trade ftse100 stocks
2. Only trade stocks with high volume
3. Only trade stocks that have low spreads
The aim is to make 5%. In a relatively short term ( a month )
I suggest you operate a 5% stop loss.( and impose it strictly )
Here's the strategy,
Use 5day and 10day moving averages, watch for an upward trend of both the MAs and the stocks price.
Buy if the stock price is above the MAs and when the 5DAY MA moves up through the 10DAY MA. Remember all 3 must be in an upward trend.
I use 5 and 10 as this is a short term strategy but you can use longer MAs for long trading ranges. EG 10 and 20 for 2 months or 50 and 100 for say 6 month strategy.
Its very easy to use but also very effective. But the best is you can do this for free on most charting www sites.
This is one strategy that can be used. There are loads of different approaches.
I suggest that anyone who reads this or any strategy on BBs trys it out themselves in PAPER ONLY. Do not risk your money till you are happy with the system. Ensure you are happy with it and it suits your style of trading.
Ok i'll try to post up the crossover report that i have created from the AIQ system every week. ( hopefully on friday nights so you get the weekend to have a good look )
It shows ( or will ) those stocks that in the last 5 days have crossed MAs ( the 5 day over the 10 day ) These are only ftse100 stocks and only those that do over 300k per day vol.
The other things to bear in mind with this report are the following,
Trend Score and Delta Trend Score
AIQ’s two special trend indicators, Trend Score and Delta Trend Score, appear on all group and sector reports. These indicators are explained below.
Trend Score (TS)
Trend Score is an extremely useful indication of the overall technical strength or weakness of each group or sector. It is derived from six technical indicators (MACD, Directional Movement, ADXR, Positive Volume, Volume Accumulation, and On Balance Volume). Trend Score is designed to give a quantitative measure of the current trend of these indicators.
A special expert system computes the Trend Score from the values of the six indicators. The indicators are all trend-following and the expert system consists entirely of trend-following rules. Trend Score values are similar to Expert Ratings in that they range between plus and minus 100, with large positive values indicating an uptrend and large negative values a downtrend.
Delta Trend Score (DTS)
Delta Trend Score measures the rate of change in the Trend Score from the previous day’s value. A large DTS value can be an indication of significant change and is often an early sign of improving technical conditions.
Don't forget to look for the TS and DTS for the group that the stock belongs to.
This strategy is not meant as financial advice and as always anyone using this or any other advice do so at their own risk. It is also the posting of a private investor and therefore not the advice of TRADE2WIN.CO.UK.
Good luck
Sefty