Best Thread US day traders thread.

PitBull said:
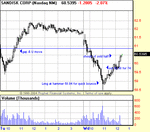
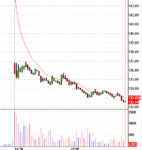
OK, its been a good day so far, so I think I will pack up for the day. Caught the bounce off of SNDK.
LONG at 58.84 out at 59.58. See both entry and exit charts.
It is a shame you did not grab the price waterfall that preceded it., when the price gapped down to 61.25, following all the high prices on very low volume, screaming at you short it was !

But well done anyway, the low was very well picked.

Good trading to you.
 
Thank you Socs. Yeah I know, but I patiently waited for my set up to unfold, so I'm sticking firmly to my rules.

Anyhow, a lesson me thinks. We all go on that its the big moves that makes our account profitable. Well, as we speak my previous LONG on PIXR is still going strong. I therefore should of sold half and let the other half run. Attached is the chart at 5.23pm.

And again, SNDK is still going strong. Oh well, can't get too upset with myself.
 

Attachments

  • PIXR3.gif
    PIXR3.gif
    10.5 KB · Views: 270
  • SNDK3.gif
    SNDK3.gif
    11.3 KB · Views: 295
occasionally like to trade the diamonds(DIA) when i feel left out because everyone around me is trading the DOW!

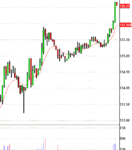
Took a long at 10552 after producing a higher low on the nice green hammer type candle. That combined with a DOW system im working on meant it was worth taking the long with a stop below the previous low. Covered at 10594...
 

Attachments

  • diatoday.GIF
    diatoday.GIF
    93.3 KB · Views: 253
Last edited:
PitBull and Socrates,
Just a thought (after recent posts on SNDK), do you guys take much notice of what your stock (and perhaps what ndx 100) is doing in the longer time frame when you trade, for example if the 60 minute for both the sock and index was in a downtrend would you still go long off a shorter time frame?
 
Samtron

No not really. I used to think like that, but I just ended up not pulling the trigger trying to figure out the bigger picture. I will look at the 60min or daily of the stock just to get a feel for support resistance, but other than that I just trade what I see, whether the stock is in a downtrend, uptrend, side trend or whatever trend.
 
BOOM, AAPL and CDCW all long trades taken early in the day for roughly 30c each. That PIXR trade I posted for 80c or so.
Lost 16c on a COST long trade and lost 11c on a LAMR short and then made that DIA trade I posted.
Farily good day.

Looks like the market kept lobbing them up for you, and you just kept knocking them right outta the park today!
 
Thanks again PitBull for the reply, yet again its helped me clarify my thoughts, a lot of text books advocate trying to make sure a number of time frames and leading indices line up with the direction of the trade you intend to take and I think I was coming to the conclusion that this approach although fine in theory would be difficult to put into practice and would just lead to indecision.
A possible approach that might work is to use the "line up" as a confidence factor and perhaps take a bigger position when a situation does arise when they do all point the same way.

keep up the good work.
 
PitBull said:
Samtron

No not really. I used to think like that, but I just ended up not pulling the trigger trying to figure out the bigger picture. I will look at the 60min or daily of the stock just to get a feel for support resistance, but other than that I just trade what I see, whether the stock is in a downtrend, uptrend, side trend or whatever trend.
I agree. it is always the bigger picture that counts, in the end analysis, because that is where the price is ultimately going to go. I do not allow myself to get tangled by adhering to timeframes. This is because a timeframe just displays what has happened within a predetermined period of time. Markets do not run on timeframes. It is like saying that the arrival and departure of migratory birds is regulated by timetables.The birds arrive and leave and that is just it. The thing to watch is to spot when they arrive or when they are getting ready to leave, and why.
 
The one that got away.........

Ok, after all the decent trades shown today, here's one for you:
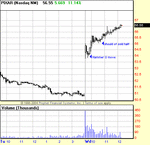
A couple of days after some coaching, with someone most of you know, I was paper trading and found the attached trade.

I still cocked it up, because that day I had already traded 2 losses, so when this one neared the round number I closed the position and took the (theoretical) profit of $0.83/share.
Felt very smug with myself and considered I'd ended up with a decent trading day. A CLASSIC beginner's mistake of not staying in a winning trade, I would think.

If had, I would probably have ridden it up to around the 26.50 mark, over $4/share profit. In a way, I'm almost glad it was only paper trading :)

The interesting thing about this one was that earnings had been announced the previous day, therefore a gap down based on that, I assume. Then they had a telephone conference call at 16:00 (times are UK) and look what happened. Whoever spoke on that call, I want their children! (And I'm not even gay....)
Rgds
DD
(1st attachment I've done, I'm sure someone will let me know if it didn't work.....)
 

Attachments

  • knsy 261005.jpg
    knsy 261005.jpg
    174.5 KB · Views: 296
A couple of things that may have helped here are to have closely observed the Level II screen at the point where you say you were nervous (at the round number). You would have a good indication of the likely continue of the move or otherwise.

Also I would suggest not regretting what may have been. If the market had turned against you at the point you took a profit then you would have been congratulating yourself and this could have happened. You made a decision and it was profitable so be happy that this made a good profit.


Paul
 
David_Davis98 said:
(1st attachment I've done, I'm sure someone will let me know if it didn't work.....)
DD,
The attachment is fine except that I can't read the notations on the chart very easily!
Tim.
 
DD,
If micro-analysis would have indicated:
a) an imminent fall, then you should have closed your long,
b) a continued rise, then you should have remained in,
c) neutral or mixed, then you should have closed half your position and left the other half open till you got an exit signal.

You do what the evidence dictates at the time. Do not follow your guess, follow the evidence.
Follow the rules and consistency follows, confidence follows, steady profit follows.
Hindsight is irrelevant. If you get another entry or reversal signal you simply take another trade according to the rules.
That is the route to consistent success.
Best wishes,
Richard
 
Trader 33 and Mr. Charts:
Thanks for that. I'm still trying to get to grips with Level 2, I seem to have a mental block around interpreting what's happening there. Thought I had it at one point but struggling again now.

The key thing on this one for me was that I let my emotions drive my behaviour. Because I'd had a scrappy day with a couple of bad trades, I was just relieved to get a good trade. If I had been trading in a detached manner, which is my goal, I would have stayed in and not reacted to the feelings I had about the previous trades.

I certainly don't have sleepless nights over it :) As the American tutor on one of the TMTT training courses said: "You can't plough a straight furrow looking back" (YEUUCH!)

And I'll put bigger fonts into attachments on any other posts for you timsk, sorry about that!

Rgds
DD
 
Good afternoon

Stocks watching today:

NVDA
WFMI
CSCO
NFLX
INTC
VPHM
CDWC
BRCM

Good luck
 
Trader333 said:
A couple of things that may have helped here are to have closely observed the Level II screen at the point where you say you were nervous (at the round number). You would have a good indication of the likely continue of the move or otherwise.


Paul
Hi Paul,
As no doubt you are aware. easier said than done, especially for a "newbie",. Boy that thing is better that a lot of pub fruit machines for flashing lights/numbers and speed of change. I suppose it must get a lot easier after a while.

What is more relevant for a situation like DD encountered, the prints or the depth of bid v offers?
I would imagine that monitoring the Ax is a prerequisite.
 
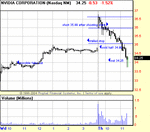
Ok done for the day. Took a small loss on VPHM but made up for it on NVDA and VPHM again.

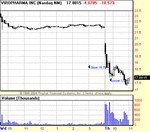
VPHM gapped down and I was looking for the quick bounce, took a long but them saw momentum fall with decrease in volume, therefore I quickly reversed as selling pressure started to increase. Went short @ 18.79 and covered in full @ 17.88.

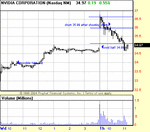
NVDA gapped up and I patiently waited for a break, got a 10am break out of the first half hour range and went short @ 35.99 after shooting star candle. Stop quickly to breakeven and sold half @ 34.99 (I remembered from yesterday that weak or strong stocks will rise and fall all day). Covered remaining half @ 34.25 when bullish engulfing candle against position.

Therefore

VPHM -0.20
VPHM +0.91

NVDA +1.74

Total $2.45

Hope you enjoy!
 

Attachments

  • vphm2.gif
    vphm2.gif
    9.3 KB · Views: 277
  • NVDA1.gif
    NVDA1.gif
    9.4 KB · Views: 264
  • NVDA2.gif
    NVDA2.gif
    9.7 KB · Views: 294
Good stuff, PitBull.
I also traded NVDA today, entering short at 35.95 and covering at 33.27 for totally different reasons to his.
for profit + $2.68

I took some screen shots of my WFMI trade.
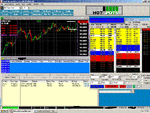
I suspect most people would have thought the first image showed it was about to go down further. However, my micro-analysis told me there was clear support around this area and I bought but with a larger stop than usual. WFMI does not behave like the NVDAs and SNDKs of the world; it's more like GOOG and other high priced stocks.
The exit was forced as I had to go out, otherwise I would have stayed in longer - this trade was not a no brainer and required experience and a lot of discipline.
for profit +$4

Quite a nice day.
Richard
 

Attachments

  • wfmilong.GIF
    wfmilong.GIF
    10.5 KB · Views: 262
  • wfmiclosed.GIF
    wfmiclosed.GIF
    9.3 KB · Views: 241
Top