UK shares ideas

china white

Established member
Messages
979
Likes
12
I have decided to pick up the old thread that now seems to be abandoned - UK shares that interest. I will post my current ideas here - it'll be 2 posts - and will see what response I will be getting :cool:

I have to aologise in advance for the poor quality of my charts - taken off Yahoo. Unfortunately here in Americas I currently have to acccess to good charts on UK individual issues :(

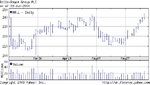
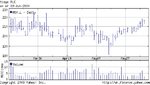
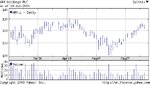
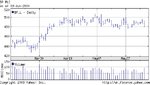
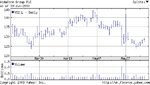
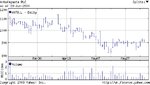
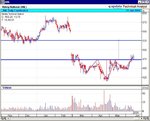
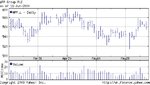
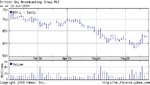
OK - where r we now. If u take a butcher's at many tech stocks lately u will see they exhibit a clear Inverse H&S pattern which MOSTLY played out. I am enclosing charts for RR, MSY and ARM (well on ARM u may argue there is still room up to 130pp). We took advantage of this pattern on RR entering long on a pullback to 220.50pp and (quite sloppily) exiting at 233+ pp. In hindsight 240 was clearly spelt in the books, however I was unwilling to stay Long into the weekend. Still 4.7% profit (after brokerage fees) on a 3 day long exposure.
 

Attachments

  • rrj.JPG
    rrj.JPG
    84.5 KB · Views: 379
  • msyj.JPG
    msyj.JPG
    84.5 KB · Views: 364
  • armj.JPG
    armj.JPG
    86.1 KB · Views: 350
some trading ideas

Going thru the issues in search for trading ideas I have come up with 3 so far - BP, VOD and ANTO.
.

BP is stuck in rangebound trading btwn 480 and 500 pp. Going long here does not offer "fat" upside as I personally do not think BP will be able to pierce 5 quid decisively in the near future, however obviously such a long now will have a very tight stop loss (from pattern). The biggest opportunity here IMO will arise if 480 gets lost - then shorting a LH on a pullback to 480 will be a very reasonable trade.

VOD recorded a double bottom (3 months time scale) and this last bottom looks very much like A&E bottom which usually spells out a big move up. I can definitely see 140 pp here, however 130 needs to be decisively taken out as it is proving to be a rather strong res here (former sup).

the biggest opportunity so far I am seeing on Antofagasta. Price action clearly recorded a first HL so it is a relatively low risk long entry with a rather tight stop loss. Volume analysis confirms long here as that HL was recorded on a volume only a HALF of what it had been on the previous low - which means the shorting supply dried up and the bulls need to buy higher. Clear wedge with a horizontal res presently at round 925 pp. IF this long works out - there is plenty of upside - 10 quid for sure (11% or so), if not 11 quid.

My intention here is to go Long round current level with a natural stop loss at slightly below 850pp.
 

Attachments

  • bpj.JPG
    bpj.JPG
    82.1 KB · Views: 303
  • vodj.JPG
    vodj.JPG
    81.7 KB · Views: 353
  • antoj.JPG
    antoj.JPG
    79.9 KB · Views: 333
how about AZN? Nice 200 point range
 

Attachments

  • azn.gif
    azn.gif
    13 KB · Views: 387
china white said:
We took advantage of this pattern on RR entering long on a pullback to 220.50pp and (quite sloppily) exiting at 233+ pp. In hindsight 240 was clearly spelt in the books, however I was unwilling to stay Long into the weekend. Still 4.7% profit (after brokerage fees) on a 3 day long exposure.

Currently short from 238. Primary target 230, secondary 215.
 
Hi CW
Thanks for this thread/posts. I think exchanging ideas on instruments and their potential movements is what a serious trader is looking for in theese boards. I will certainly be watching it and contributing when I get back to full time trading next week. Excellent!
 
China white,

ANL showing a good inverse H &S pattern., with a price target of around 525. Please note this is just a good illustration of inverse H&S pattern and not an invitation to trade.
 

Attachments

  • anl.jpg
    anl.jpg
    54.3 KB · Views: 371
BCT, Hi
What concerns me about ANL's H&S is that it took over three months to form. How long would you say before the target is reached? I looked next door (litterally!) at AL. which also seems to have formed H&S albeit not so clear but in about half the time. This aside, any comments on the comparison of the two charts?
By the way it's the first time I attach an image... I hope it works
 

Attachments

  • AL.gif
    AL.gif
    14.3 KB · Views: 341
Several interesting UK shares at the moment.

I agree with Barjon - AZN is a particularly nice range bound chart.

Also GLH is building a large ascending triangle.

LLOY has a Fib fit going back a year now. A spinning top two days ago suggests that its going to fall back to ~413 but if it breaks upwards then ~483 is the target.

I'm not sure about ANL - I would like to see a decent downtrend before the H&S instead of that gap. However 490 is strong Support/resistance so it might play-out anyway
 

Attachments

  • ASILLOY10062004.jpg
    ASILLOY10062004.jpg
    33.6 KB · Views: 343
Hi nicos,

John Murphy in "Technical Analysis of the Financial Markets " argues that H&S is probably the most reliable of all reversal patterns. And according to Thomas N Bulkowski in "Encyclopedia of Chart Patterns " H&S bottoms are short-term (up to 3 months) bullish reversal patterns, with a failure rate of 5%. He indicates an average rise of 38% with 83% predicted to meet the formation price target.

For the formation to be more reliable, the volume should be higher on the left shoulder than the right. So far the ANL formation looks promising as the attached price/volume chart seems to indicate.

I think it would probably take about a month to reach the target. This is roughly the time scale if you measure either peak - peak or trough - trough.

IHTH
 

Attachments

  • ANL-1.jpg
    ANL-1.jpg
    72.7 KB · Views: 311
ANL - agreed, i think any pullback to 475ish will find a strong sup from resolved former res, exactly as it happened on Friday. However, i am concerned as well with regard to the time horizon of any Long trade - it just may take to long to clock up expected profits :)

may i also ask everyone for a big favour? as I said i am currently enjoying :) americas and have no access to professional charts on UK issues. can u lads/lasses include volume histogramme on the charts that u publish? that is a crucial bit of info.
 
AL - respectfully disagree. Firstly it needs to resolve 850ish which is a strong res from previous price action. Secondly, whats your profit/risk ratio here? Yout target cannot exceed 880 can it? However entering Long here u need to place your stop loss at somewhere slightly below last HL - round 810. Potential upside of 3.5% with a stop loss at 4.7%. Not to my liking :)

Volume. U c spikes of volume very lately with no price movement. Prior to that we saw a run from 810 to 850 on minimal consequential volume. What is it telling us? not too much long interest to start with, with those who r long closing positions at 850 resistance level. It is the small fish who convinced themselves lately there is a bull run coming up buying from those professional longs. Which side wud u rather be on? :)
 
Bgc

Hmm...

Please take this with a pillar of salt...I find BGC very hard to analyse and am just doing this for fun really.

Weekly chart (not shown) sort of 5 wave down pattern completed at May low

Daily: Peeking above trendline drawn from Nov 2003 swing high with three boolish white soldier candles.
Measured move from Mar 4 high to May 18 low complete

Resistance at 115 crucial to next move IMHO. It represents heavy previous support turned resistance and a neckline of the inverse H&S formed between Apr 27 and now. Clear it and we're perhaps good for 130-135 (wonky W / inverse H&S pattern height is about 15 points, next res at 135)

HH and HL printed this month. Mind you this happend in Mar/Apr and it turned out to be a bear flag. However this pattern looks less 'flaggy'!

Less volume needed on HL hammer buying than after previous low meaning less shorts around to supply stock (compare x and y). Could be bullish.

But if this turns out to be a rising bear wedge instead and 100 goes then expect 87p.

Apologies for double monitor screenshot! Scroll to the right >>>
 

Attachments

  • untitled.GIF
    untitled.GIF
    322.8 KB · Views: 251
Last edited:
Three charts for your (further) thoughts with usual caveats about not an invitation to trade etc.:

1. ANL - hasn't it yet to break the neckline to complete inverted H&S?

2. AZN - only just peeped into the buying range this time. Had a little nibble but jumped out
'cos didn't like it changing tack at the halfway mark (which is unusual on previous
pattern). If it drops into the buying range probably need to see a good reversal signal
just in case it keeps going. I would have quite liked today's hammerish candle had
the volume been a bit more convincing.

3. GSK - This one from swing chart. Has just completed a first reaction swing high and given
a short signal on falling below that swing high bar low. Not particularly convinced
about it, but that's the system. Only half position since ftse 15 day trend is up ,stop
sitting just above the swing high.
 

Attachments

  • anl.gif
    anl.gif
    10.2 KB · Views: 249
  • azn.gif
    azn.gif
    15.1 KB · Views: 266
  • gsk.gif
    gsk.gif
    11.7 KB · Views: 299
Frugi - my take is that if u r not long from 108 (which was the lowest risk entry), u may want to wait for 115 to pop and then buy a pullback to 115. Eyes on volume of coz which will tell the true story :)
 
wpp and bskyb

2 potentially good long trades

WPP - look at the last bottom - clear doji with a long tail on miniscule volume - bulls were not meeting enough short supply and had to buy sharply higher. steadily increasing volume on the way north, looks like bulls have been cooling it off lately bringing share to former res (now resolved as sup). Now volume "rare air" where new wave of buying can burst. Long at 550+ is very tempting indeed.

BSY - look at intense short covering at the last "Eve" or "cup" type bottom. Bulls firmly in control of volume on the latest thrust up. Now same "rare air" again on a re-test of former res (now sup) from above. 1st target 665, second 700. Def worth a long at present 625 ish level IMHO

Pls note this is my trading ideas and not any sort of tips. Personally I am long Antofagasta here at 880.50 average and sticking to my position.
 

Attachments

  • wppj.JPG
    wppj.JPG
    84.5 KB · Views: 244
  • bsyj.JPG
    bsyj.JPG
    77.3 KB · Views: 231
China

I'd be very careful with that Yahoo UK data. I looked at the WPP chart on my Reuters feed and that big low volume doji isn't there - nor is it on BigCharts.

Many thanks for posting your ideas - BSY is on my radar too as a potential long.

KenN
 
if you wish to add to your portfolio,(factoring fund,) if you can in invest for two years,you will recive after the first quarter,fixed rate intrest,if take the money out before, you would lose your intrest you have had and also intrest left to run of term,however,minimum is 5,000 @ 8.25 % / 15,000 gives you the 11.25%
contact e-mail [email protected] they are very help full. (kevinf)
 
what was that, kevinf? u must've posted in the wrong place mate :)

knorrie - i agree, well be very critical of my posts pls - like i said i hvnt got a good feed to UK stocks from where i am. btw - wud u mind posting WPP's correct chart with correct volume readings? thx
 
Top