You are using an out of date browser. It may not display this or other websites correctly.
You should upgrade or use an alternative browser.
You should upgrade or use an alternative browser.
UK shares ideas
- Thread starter china white
- Start date
- Watchers 10
china white
Established member
- Messages
- 979
- Likes
- 12
lads/lasses correct me if i am wrong.
I've bn comparing 2 charts on WPP (courtesy of barjon). 2 explanations possible.
1) either Yahoo is so mucked up that i shud get a life and shut up until i come back to the civilised world where i can access proper charts;
2) or Yahoo actually counts (somehow) OTC transactions which are not on the tape and thus gets those "extensions". If (IF!!!!) that is true it is actually an invaluable piece of info.
what i am gonna do i am gonna phone me mate who is still trading WPP pro and ask him what was going on on that particular day. let's sort it out... any comments r greatly appreciated.
china white
Established member
- Messages
- 979
- Likes
- 12
very odd mate 🙂 that is why i want to investigate into the matter
Barjon's chart looks pretty close to mine - I couldn't post it as I can't seem to disable all of my popup killers/firewall crap to be able to post an attachment on here :-(
Yahoo data is spiky, reminds me of MyTrack UK data 🙂 But I don't think it's just a problem of unfiltered trades though - often the volume is just complete crap, out by billions, and you get sometimes get pure errors like Close > High. The only reason I've spotted all this is that I've been using Yahoo to get free UK EOD quotes into my (excellent BTW) AmiBroker package and noticed discrepancies with the Reuters charts I happened to look at during the day. Do a bar-by-bar comparison and sometimes you think you're looking at a different stock they are so different. I'm in the process of moving over to MSN MoneyCentral, which AmiBroker also supports as a free EOD feed, and so far it looks a lot better. It also has the advantage that you can download 5 years of historical data in one operation, instead of splitting it up into 200 day chunks like you have to do for Yahoo.
KenN
china white
Established member
- Messages
- 979
- Likes
- 12
matey it is still an open question whether OTC trades that were done outside the exchange and therefore (by our good old LSE rules) did not get printed on the tape. As u know we r the only exchange in the world where it is still legal..... I doubt very much yahoo can dig as deep as displaying OTC trades, but before i know that for sure, that is my suspicion..... pls bear with me, i havent talked to me china yet. In the meantime pls doubt everything i post and say - well u shud be doing it anyway 🙂
china white
Established member
- Messages
- 979
- Likes
- 12
yes i can confirm it - it was an OTC trade done well below the market and off the tape. i am amazed that yahoo picked it.
Can volume actually be used with any real degree of accuracy on UK stocks? I seem to remember a discussion on these boards a while back in which it was stated that if a trade was being 'worked', it did not have to be disclosed until complete. Obviously less of an issue with EOD data, as opposed to a shorter time frame, but still a potential problem - anyone able/care to elaborate?
china white
Established member
- Messages
- 979
- Likes
- 12
simon very good comment.
in short, volume traded is not the only thing u want to know. U also want to know open interest (bidding and offering) and depth of market. THE LESS LIQUID is the instrument, the more important is the open interest. For example when u trade ES, volume is an absolute monarch 🙂 personally i do not even go into open interest much. On the other hand, when u trade listed options, open interest may prove more important than volume traded itself.
in short, volume traded is not the only thing u want to know. U also want to know open interest (bidding and offering) and depth of market. THE LESS LIQUID is the instrument, the more important is the open interest. For example when u trade ES, volume is an absolute monarch 🙂 personally i do not even go into open interest much. On the other hand, when u trade listed options, open interest may prove more important than volume traded itself.
china white
Established member
- Messages
- 979
- Likes
- 12
update on current position - 925 ish crucial level on Antofagasta, needs to pop decisively to go to tenner as 1st target, potentially 11 quid.
china white
Established member
- Messages
- 979
- Likes
- 12
Antofagasta - 925 resolved as res/sup.
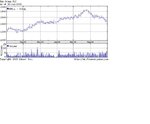
Can someone do me a big favour? can u post good price-volume charts for BSY.L - say one intraday covering last 10 sessions and another daily covering say 2 months? Much appreciated. I can smell an opportunity here but I need to see proper charts to be sure 🙂
Can someone do me a big favour? can u post good price-volume charts for BSY.L - say one intraday covering last 10 sessions and another daily covering say 2 months? Much appreciated. I can smell an opportunity here but I need to see proper charts to be sure 🙂
BlueChip Trader
Active member
- Messages
- 165
- Likes
- 4
china white
Established member
- Messages
- 979
- Likes
- 12
many thx lads! much appreciated.
keeping Antofagasta long.
will be buying BSY.L on an early dip below 610 tomorrow morning provided volume does not escalate to the downside.
keeping Antofagasta long.
will be buying BSY.L on an early dip below 610 tomorrow morning provided volume does not escalate to the downside.
china white
Established member
- Messages
- 979
- Likes
- 12
just came back from mexico and leaving tomorrow again so apologies for hiding in the desert... 🙂
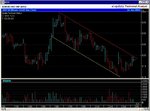
Antofagasta - classic run to "almost" 10 quid level, good example of how u want to place your take profit limit slightly below such a number - obviously if volume is not justifying taking it out immediately on the 1st try - which was exactly the case with ANTO. Now interesting - 925 (previous level of importance) tested with a quick recoil of price back north from it.
B Skies - if u were on your toes long from 610 wud fetch u 2-3%, quite clear exit from the price pattern. Not impressive at all compared to 10% + profit from Antofagasta but hey u pocket what the mrkt gives u.
Minx,
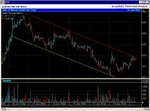
On the basis that we are approaching round number support, also from the recent frenzy in volume i am assuming shorts are covering and we should see a test of 1500.
Or i could wait for the pullback and short again, after all we are in a downtrend.
On the basis that we are approaching round number support, also from the recent frenzy in volume i am assuming shorts are covering and we should see a test of 1500.
Or i could wait for the pullback and short again, after all we are in a downtrend.
Similar threads
- Replies
- 6
- Views
- 3K