You are using an out of date browser. It may not display this or other websites correctly.
You should upgrade or use an alternative browser.
You should upgrade or use an alternative browser.
UK shares ideas
- Thread starter china white
- Start date
- Watchers 10
china white
Would you consider going long again particularly if it re-tests 582 ( 52 week low ) As I type it is at 602.
Regards
bracke
"B Skies - if u were on your toes long from 610 wud fetch u 2-3%, quite clear exit from the price pattern. Not impressive at all compared to 10% + profit from Antofagasta but hey u pocket what the mrkt gives u."
Would you consider going long again particularly if it re-tests 582 ( 52 week low ) As I type it is at 602.
Regards
bracke
Last edited:
Stopped out of EMG at 1478....
Since mid April:
Fall from 1850 - 1600 = 250...then consolidated @ 1600
Further fall from 1600-1350=250...
I feel we have seen the bottom, i will enter again at the lows of the consolidations, asit tests 1550 (top of downtrend).
What else are you looking at minx?
Bracke:
Waiting for BSY to to touch 590 before I enter long, it has shyed away from breaking the inv hs neckline...
Hi all
I posted this in a seperate thread yesterday stating
- "Has anyone checked BSY out - the charts are pointing towards a rise pretty soon if it breaks out of that wedge and hits the 16 month support" - before i had read this one
glad to see some other interest in it
I posted this in a seperate thread yesterday stating
- "Has anyone checked BSY out - the charts are pointing towards a rise pretty soon if it breaks out of that wedge and hits the 16 month support" - before i had read this one
glad to see some other interest in it
minx
Well-known member
- Messages
- 328
- Likes
- 10
Today was looking at long SAB and short SBRY, both on the close......
Quick question on SBing these,
Daily SB costs about 0.3% and the futures about 0.6%, how long does the trade have to be before it becomes better to use the future over the rolling daily?
Can anyone tell me the answer to this, esp in regard to Capital Spreads calculations...
Thanks guys.
Quick question on SBing these,
Daily SB costs about 0.3% and the futures about 0.6%, how long does the trade have to be before it becomes better to use the future over the rolling daily?
Can anyone tell me the answer to this, esp in regard to Capital Spreads calculations...
Thanks guys.
Attachments
minx said:Today was looking at long SAB and short SBRY, both on the close......
Quick question on SBing these,
Daily SB costs about 0.3% and the futures about 0.6%, how long does the trade have to be before it becomes better to use the future over the rolling daily?
Can anyone tell me the answer to this, esp in regard to Capital Spreads calculations...
Thanks guys.
If you do not get the answer to your question here may I suggest you go to the Capital Spreads
thread and ask it there.
Regards
bracke
I have put together a portfolio of stocks that are potential takeover targets and have been trading them over the last few months with good results - wanted to know if anyone else has experience in this field (risk arbitrage - I beleive is the correct term, correct me if I am wrong) ?
For example, entered WHSMITHS at 309 with a tight stop - I generally raise the stops if positive news has a significant upside on the price. Is there anyway to use TA for trading these types of stocks in these unique circumstances (i.e. very news sensitive , trading withing tight ranges between news updates) ?
Thanks.JK
CityTrader
Established member
- Messages
- 666
- Likes
- 26
jklondon said:I have put together a portfolio of stocks that are potential takeover targets and have been trading them over the last few months with good results - wanted to know if anyone else has experience in this field (risk arbitrage - I beleive is the correct term, correct me if I am wrong) ?
Risk arbitrage is either buying the bidee and selling the bidor ( or vice versa) Arbitrage by definition, means buying one instrument, and selling another related product.
SAB Miller
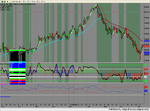
Hi Minx, interesting choice of a long in SAB, What's your target there? and how long are you looking to hold your position? The reason that this grabbed my attention is that recently I've been considering shorting SAB and thought it was interesting to find someone else on the other end of my trade as it where. With the complete opposite opinion on the stock, which i think is great. It's how the market's work i suppose. So i'll state my perception on this one, if that's ok with you guys!
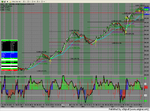
Looking at my charts i like to buy in the areas marked with a round circle as for me this marks an area of value. Where the stock has regressed to an area where buyers like to come back in. With the MACD's on both charts not making the same higher highs as the price and the price looking toppy (clear on the weekly chart) being at its upper trend line area. I use the 26 ema to signal the buy area's and the 130 on the daily represents that weekly ema.I use a 11-15ema on the daily to find entry and exits although candlestick analysis can give me an early indication of the direction. IMHO I believe a move upward might be short lived, but it might just be long enough to get in and out if your really quick! If there's a some key fundamental infomation realised soon then that may shift it upward into a new trend or if the sentiment on this is bearish then a regression down should follow. The rules i set and the patterns i notice in short situations signalled the recent GUS down move. Looking for good MACD Divergence in both positive and negative situations works well for me. And my trades normally last a few days to a few weeks. Thanks for reading
minx said:Today was looking at long SAB and short SBRY, both on the close......
Quick question on SBing these,
Daily SB costs about 0.3% and the futures about 0.6%, how long does the trade have to be before it becomes better to use the future over the rolling daily?
Can anyone tell me the answer to this, esp in regard to Capital Spreads calculations...
Thanks guys.
Hi Minx, interesting choice of a long in SAB, What's your target there? and how long are you looking to hold your position? The reason that this grabbed my attention is that recently I've been considering shorting SAB and thought it was interesting to find someone else on the other end of my trade as it where. With the complete opposite opinion on the stock, which i think is great. It's how the market's work i suppose. So i'll state my perception on this one, if that's ok with you guys!
Looking at my charts i like to buy in the areas marked with a round circle as for me this marks an area of value. Where the stock has regressed to an area where buyers like to come back in. With the MACD's on both charts not making the same higher highs as the price and the price looking toppy (clear on the weekly chart) being at its upper trend line area. I use the 26 ema to signal the buy area's and the 130 on the daily represents that weekly ema.I use a 11-15ema on the daily to find entry and exits although candlestick analysis can give me an early indication of the direction. IMHO I believe a move upward might be short lived, but it might just be long enough to get in and out if your really quick! If there's a some key fundamental infomation realised soon then that may shift it upward into a new trend or if the sentiment on this is bearish then a regression down should follow. The rules i set and the patterns i notice in short situations signalled the recent GUS down move. Looking for good MACD Divergence in both positive and negative situations works well for me. And my trades normally last a few days to a few weeks. Thanks for reading
Attachments
minx
Well-known member
- Messages
- 328
- Likes
- 10
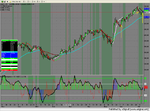
To be honest I cut a nice long a few days ago and it's just a re-entry. Both trades are the bounce off fib levels, I will have a tight stop on this though.
SAB loves bouncing off the 38%fib level, there have been some great trades off it, buy when it closes above the 25% line 😀
SAB loves bouncing off the 38%fib level, there have been some great trades off it, buy when it closes above the 25% line 😀
Attachments
china white
Established member
- Messages
- 979
- Likes
- 12
fully out here of Antofagasta. +16.6% profit on 2 long legs after brokerage fees. did not play the short leg (from 980 to 930) given the overall strength, which in hindsight i shud've 🙂
still a very bullish pic on chileans (11 target) - just do not want to get married to one particular stock 🙂
long ideas here:
1) BSY on an early morning dip to 607.50 ish
2) WPP below 520
3) RTR at 333 level.
all those longs have obviously very natural tight stop losses.
Sage looks also good at this level, I just cannot see any upside above 190 here. All the above-mentioned stocks have much better target/stoploss ratios.
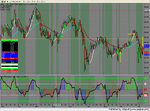
Rtr
I quite like the idea of RTR the only thing that bothers me slightly is the support at 330 it's really only been tested once. But having said that if i wait and find out whether it is good support, i miss the opportunity! There's some nice bullish belt hold candles in the 330 which is good and some MACD Divergence in it's favour so i might consider this one later near the close.
china white said:fully out here of Antofagasta. +16.6% profit on 2 long legs after brokerage fees. did not play the short leg (from 980 to 930) given the overall strength, which in hindsight i shud've 🙂
still a very bullish pic on chileans (11 target) - just do not want to get married to one particular stock 🙂
long ideas here:
1) BSY on an early morning dip to 607.50 ish
2) WPP below 520
3) RTR at 333 level.
all those longs have obviously very natural tight stop losses.
Sage looks also good at this level, I just cannot see any upside above 190 here. All the above-mentioned stocks have much better target/stoploss ratios.
I quite like the idea of RTR the only thing that bothers me slightly is the support at 330 it's really only been tested once. But having said that if i wait and find out whether it is good support, i miss the opportunity! There's some nice bullish belt hold candles in the 330 which is good and some MACD Divergence in it's favour so i might consider this one later near the close.
Attachments
china white
Established member
- Messages
- 979
- Likes
- 12
Out of the stocks i mentioned in my last post I must agree RTR looks most promising to me in 330-333 range.
CW may leap north from 115 level. I'd like to see an upthrust first and to buy a Higher Low (HL) pullback though.
Pretty same story with Pearson. I want to see 640 taken out on a good volume pattern and then buy a HL pullback to 635ish
Short ideas - ITV. I'd luv to see a fake upthrust to slightly above 110 and then volume confirmed offloading back south below 110. if that plays out, trgt 90ish IMO.
minx
Well-known member
- Messages
- 328
- Likes
- 10
china white said:Short ideas - ITV. I'd luv to see a fake upthrust to slightly above 110 and then volume confirmed offloading back south below 110. if that plays out, trgt 90ish IMO.
I agree with you on ITV, going to see how it pans out today, the trend is snaking southwards and the weekly is pointing down on my indicators too....
Similar threads
- Replies
- 6
- Views
- 3K