TT Toolbox

ok so interval is the data compression, so best to keep interval then and set to 1 minute to be sure. thanks
Jayjay

I have sent you a PM, but for the benefit of others the data compression in TS8.3 can be changed by highlighting the symbol column in radarscreen, right clicking to choose format all symbols and then changing the value in the Interval settings to match the value shown in the N MIN COMP function as the day progresses. It will change every 14 minutes, but I initially set it to 5 mins for the first hour.

Charlton
 
thanks, but i still don't have n minute comp column?, is there any code for this?, as i have the n minutes change code but not comp?
 
Jayjay

I have sent you a PM, but for the benefit of others the data compression in TS8.3 can be changed by highlighting the symbol column in radarscreen, right clicking to choose format all symbols and then changing the value in the Interval settings to match the value shown in the N MIN COMP function as the day progresses. It will change every 14 minutes, but I initially set it to 5 mins for the first hour.

Charlton


i still can't find n minute comp?
 

Attachments

  • tocharlton.PNG
    tocharlton.PNG
    201.5 KB · Views: 50
Ely

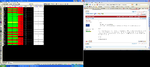
I am using TS 8.3 and a tradestation feed and have no problems with any of Glenn/Iraj's code. The only difference between your screenshots and my settings are that I have Update value intrabar ticked on the format indicator for the Iraj N minute change. You did not include a copy of your format indicator settings for the MISC function that contains the Nmin Comp, but again I have the Update value intrabar ticked.

With regard to the question on XAverage, I think there are 2 things to consider. First you are using the "Last" price which is the price of the last completed trade, whereas you will plotting the "Close" price on the chart, which is the closing price of the bar for the specified bar interval.

However I think the real issue is highlighted in these help notes from Easylanguage

"Historical calculations for RadarScreen (Quotes) and OptionStation indicators are performed by loading only the minimum number of bars required. Accumulation or smoothing type indicators such as the Moving Average Exponential Indicator build values based upon the values of previous indicators. Unless you add additional bars of data, the values for these indicators may differ slightly in RadarScreen and OptionStation from those for the same indicator in Chart Analysis.

To ensure that the values of these indicators are consistent between RadarScreen, OptionStation, and Chart Analysis, you can load additional bars of data. To do this, you need to enable the Load additional data for accumulative calculations option on the Format Indicator - General tab. You can then specify the number of additional bars to load so RadarScreen and OptionStation will perform the necessary "bring forward" calculations. The values for these indicators will then match those in Chart Analysis. See Maximum Number of Bars Study Will Reference for more information about historical bar references"

Thus I think you might resolve your issues if you go to the format indicator for your xaverage indicator within radarscreen and set the "Load additional data for accumulative calculations" to at least 10. This will ensure that when it starts calculating afresh it has all the data it requires immediately.

Charlton


Historical calculations for RadarScreen (Quotes) and OptionStation indicators are performed by loading only the minimum number of bars required. Accumulation or smoothing type indicators such as the Moving Average Exponential Indicator build values based upon the values of previous indicators. Unless you add additional bars of data, the values for these indicators may differ slightly in RadarScreen and OptionStation from those for the same indicator in Chart Analysis.

To ensure that the values of these indicators are consistent between RadarScreen, OptionStation, and Chart Analysis, you can load additional bars of data. To do this, you need to enable the Load additional data for accumulative calculations option on the Format Indicator - General tab. You can then specify the number of additional bars to load so RadarScreen and OptionStation will perform the necessary "bring forward" calculations. The values for these indicators will then match those in Chart Analysis. See Maximum Number of Bars Study Will Reference for more information about historical bar references.

Charlton,

The loading of additional bars of data solve the problem with the EMA. I ended up loading 200 bars since that's what the one included with TS8 was set at.

Thanks,
-E
 
thanks charlton again,

has any body got the global variable dll code or file for use with ts8?
 
ok thanks someone has emailed me the code, so how do i open it? or where do i put it please?
 
hi thanks ely, can u tell me exactly where as i have put it into \Program Files\TradeStation 8.3 (Build 1634)\Program but still not working.........does it go into a sub directory within \TradeStation 8.3 (Build 1634)\Program?
 
hi thanks ely, can u tell me exactly where as i have put it into \Program Files\TradeStation 8.3 (Build 1634)\Program but still not working.........does it go into a sub directory within \TradeStation 8.3 (Build 1634)\Program?

The GlobalVariable.dll should go into "C:\Program Files\TradeStation 8.3 (Build 1634)\Program". So if I were to include that file in the path, it would look like "C:\Program Files\TradeStation 8.3 (Build 1634)\Program\GlobalVariable.dll".
 
hi thanks ely, can u tell me exactly where as i have put it into \Program Files\TradeStation 8.3 (Build 1634)\Program but still not working.........does it go into a sub directory within \TradeStation 8.3 (Build 1634)\Program?

Jayjay

I agree with Ely - that is the exact same directory where mine is stored. Try clicking on this link in the Tradestation support page. It has all documentation and the download

https://www.tradestation.com/Discus...&SearchTerm=globalvariable.dll&txtExactMatch=

Charlton
 
Multiply Time Frame MACCI

MACCI_MTF – Numeric function. It calculates N-minute MACCI value using 1-minute data.

MACCI MTF PB – plots Paint Bar when MACCI overbought / oversold on all time frames.

MACCI MTF - Multiply Time Frame MACCI indicator for TradeStation 8 and MultiCharts.
It plots MACCI for 3 time frames and overbought / oversold levels.

We can use only 4 plots on TradeStation 2000i so we need 2 indicators:
MACCI MTF TS2000i – plots 3 time frames MACCI.
OB OS TS2000i – plots overbought / oversold levels.
Set scaling to 200, -200 for both indicators and place them on the same Subgraph.

attachment.php
 

Attachments

  • MACCI MTF.zip
    2.6 KB · Views: 60
  • MACCI MTF.png
    MACCI MTF.png
    30.7 KB · Views: 213
Last edited:
MACCI_MTF – Numeric function. It calculates N-minute MACCI value using 1-minute data.

MACCI MTF PB – plots Paint Bar when MACCI overbought / oversold on all time frames.

MACCI MTF - Multiply Time Frame MACCI indicator for TradeStation 8 and MultiCharts.
It plots MACCI for 3 time frames and overbought / oversold levels.

We can use only 4 plots on TradeStation 2000i so we need 2 indicators:
MACCI MTF TS2000i – plots 3 time frames MACCI.
OB OS TS2000i – plots overbought / oversold levels.
Set scaling to 200, -200 for both indicators and place them on the same Subgraph.
A_B

I like that - I use TS8.3 and have each of the time frames in separate charts, which does take up a lot of screen space and requires Wimbledon tennis style vision to see all the timeframes at once. I will add your way of presenting it to my setup and set up a paint bar as well.

Chartlon
 
A_B

I like that - I use TS8.3 and have each of the time frames in separate charts, which does take up a lot of screen space and requires Wimbledon tennis style vision to see all the timeframes at once. I will add your way of presenting it to my setup and set up a paint bar as well.

Chartlon

if anybody knows how to do this in ts8 it would be much appreciatted
 
if anybody knows how to do this in ts8 it would be much appreciatted

I have inputted and verified the code in TS8.3. In fact I didn't need to change any of A_B's code at all.

The attached file contains a function, indicator and paintbar.

To load it just use File > Import/export and choose Import Easy language file

Once loaded - create an INDU 1 min chart and then Insert > Indicator
and choose MACCI MTF

Then Insert > Paintbar - and choose MACCI MTF PAINTBAR

I have posted a screenshot of the result.

Once again thanks go to A_B for doing the coding

Charlton
 

Attachments

  • MACCI_MTF_TS8.ELD
    9.9 KB · Views: 47
  • MACCI_MTF.png
    MACCI_MTF.png
    34.8 KB · Views: 69
Macci code for Esgnal

Here's the code I wrote at Grey1's request some time ago:-

/************************************************** *******************************
MACCI using a 5 period sma of a 6 period CCI based on (h+l+c)/3

************************************************** ********************************/
function preMain() {
setPriceStudy(false);
setStudyTitle("MACCI");
setCursorLabelName("MACCI", 0);
setDefaultBarFgColor(Color.blue, 0);
setPlotType(PLOTTYPE_LINE,0);
setDefaultBarThickness(1,0);
addBand(100, PS_SOLID, 1, Color.black,"Upper");
addBand(-100, PS_SOLID, 1, Color.black,"Lower");
}

var xPrice = null;
var xAvgPrice = null;
var xCCI = null

function main(Length){

if(Length==null) Length = 6;

if(xPrice==null) xPrice = close();
if(xAvgPrice==null) xAvgPrice = sma(Length,xPrice);

if(xPrice.getValue(-Length)==null||xAvgPrice.getValue(-Length)==null) return;

var Sum = 0;

for (i=0; i<Length; i++){
Sum += Math.abs(xPrice.getValue(-i)-xAvgPrice.getValue(0));
}

var MeanDevPrice = Sum/Length;


if(xCCI == null) xCCI = (xPrice.getValue(0)-xAvgPrice.getValue(0))/(MeanDevPrice*0.015);
var MACCI = sma(5, cci(6, hlc3()))
return MACCI;
}


Glenn
 
Top