Macci_ts8
Hi,
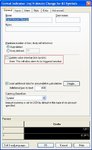
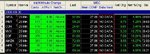
Wondered if anybody can help me i am using the MACCI_TS8 but can not get the alarms to operate.On other indicators that are in TS8 i do not have any problems.
Also i would like to have an alarm set for when 10 min macci approaches +80 from oversold and -80 from overbought
I have no knowledge of easy language (will work on this in time) so am a bit stumped any help appreciated.
Regards
Graham
Hi,
Wondered if anybody can help me i am using the MACCI_TS8 but can not get the alarms to operate.On other indicators that are in TS8 i do not have any problems.
Also i would like to have an alarm set for when 10 min macci approaches +80 from oversold and -80 from overbought
I have no knowledge of easy language (will work on this in time) so am a bit stumped any help appreciated.
Regards
Graham