Dentalfloss
Legendary member
- Messages
- 63,404
- Likes
- 3,726
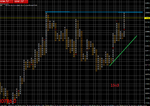
dax needs to get 10770 as supp
ask Cigar..he recently bought bullseye...i think its $100Love to see your profit/loss figures ?
How much is the bullseye package ?
all good in hereEvening all hope you all had a great xmas break. Looks like the market has been good to you
plenty of pips in the shed?
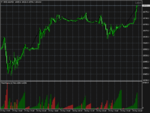
dax over last 2 weeks
this chart gives a better feel of the price movement
Regardless, some more information on your money management techniques would add a lot more into the mix.what you do with it is up to you
the odd comment is added when things go right
only 2 simple thingsRegardless, some more information on your money management techniques would add a lot more into the mix.
Hi Cigar,
Dentist says you are the guy to ask about Bullseye. I have just looked at their site. It seems $40,000 is about the minimum to start ? This is way above my means. Perhaps there is a cheaper way.
Have you dumped it for Weis waves already ?

10852...good enough for me10861-10883 looks the better cluster area ...imho
but..who knows...
scalp short in from that area10852...good enough for me