Dentalfloss
Legendary member
- Messages
- 63,404
- Likes
- 3,726
dax

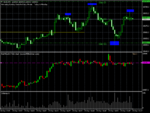
a bad bounce and bulls will have to start singing
stopped outwham..straight into our 10637...marked on the chart ealier
still bouncingexcellent bounce from 2043 and 10637
aapl discounting apple watch...oh dear