Trading the US the Naz/Mr. Charts Way

Status
Not open for further replies.
NXTL was a no-brainer based on pre-market behaviour and my tape and level 2 reading.
I could see the buying power coiling so the "risk" was 2c and the "reward" turned out to be 30c in under 2.5 minutes
 

Attachments

  • nxtl170204.gif
    nxtl170204.gif
    119.6 KB · Views: 626
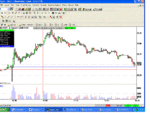
The chart to go with that trade and some further explanation.
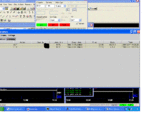
NXTL opened at 28.45, fell rapidly in the first few seconds, then my reading of the tape and level 2 showed the buying power as it surged back up so my entry was on the button at 28.45.
It hesitated at 28.75, rose and then fell back to the same level.
The behaviour there was enough for me to grab what the market offered and take a quick "scalp".
For me that 28.75 showed some significance on a micro level and the stock remained on my radar.
The chart doesn't really show much at the time of the trades - the fact is that chart understanding is a lot more than you can read in any book or on any web site - it is tied up inextricably with what is happening on the micro level and being able to read that properly. The only ways to get to that degree of understanding are, imho, to be taught and then get plenty of practice afterwards before trading or to literally spend years trying to figure it out for yourself.
What is particularly interesting on this chart is that precise balancing point of the interaction of buyer and sellers I identified at 28.75 proved significant later as support and resistance.
Richard
 

Attachments

  • nxtl170204.2.gif
    nxtl170204.2.gif
    105.1 KB · Views: 625
Last edited:
Another no-brainer
Huge gap up - what would you do if you were a holder of this stock - sell of course and lock in your huge profit! - I read the tape and level 2 the way I do and played the move - exited when I could see the buyers coming in.
Richard
 
The second RMBS entry was the fall through the immediately preceeding pivot low on the 2.45 one minute bar combined with reading the bids/offers/level2 (micro reading).
The exit was again buyers coming in.
Richard
 
Quite a nice day considering the indices are pretty flat.
This is why I trade and coach US intraday stock trading - you can usually find good movers even when others trading the futures/indices find it hard because of the choppiness.
I deserve a break.
 
Richard,

I was also watching RMBS and this trade you have made I would have thought was very risky. The entry at 35.70 which you posted at 14.33 (so must have been placed before that) went between 35c and 55c against you before going into profit.

What was your stoploss for this trade as even at 35c I would have considered that far too high ?


Paul
 
Paul,
Not so, that trade never went against me at all. I think you are assuming the short was taken the moment it FIRST hit 35.70.
As it fell AGAIN to 35.74 I put a short limit order in at 35.70

boy,
Thank you, coming from you that is quite a compliment ;-)))
Richard
 
Richard,

Well now I am confused. If you entered at or before 14.33 as
that is when you posted and you got filled at $35.70 then next 2
mins of trading saw the market trade at $36.00 and above. I
watched it in realtime and I dont see at all how you could have
not had the market go against you because at 14.34 the market
hit $36.00 and I will post the charts if you want. If you were in
that trade at that price by 14.33 the market did go against your
position before it then went down to the point where you made
your exit.


Paul
 
Status
Not open for further replies.
Top