The S&P 500 anchors these relationships, ranking as the most popular equity futures contract in the world, often foretelling broad directional impulses without other contracts or market signals. There are two common ways for active traders to play S&P 500 index futures. First, take risk directly in reaction to typical technical analysis signals, including breakouts, breakdowns and pullbacks. Second, apply feedback to other instruments in highly correlative environments, in which thousands of equities, currencies and other world markets trade in alignment with, or in opposition to, futures contracts. This synchronicity is common at key turning points when institutional capital allocates risk based on broad macro forces, rather than the attributes of individual securities.
Price Progression and S&P 500 Signals

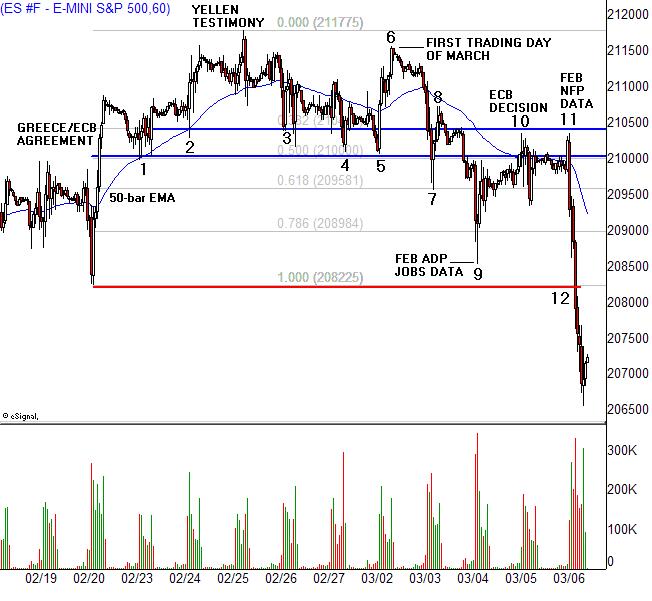
Let’s examine a typical S&P 500 price progression and how it foretold a major decline while providing active traders with a series of short-term buy and sell signals. We will use the 60-minute, 24-hour chart, a staple for futures traders because it captures overseas events while highlighting key levels not hit during the U.S. session. The contract rallies from 2082 to 2118 between Feb. 20 and 25, and pulls back. A Fibonacci grid stretched over the price swing captures the step-by-step deterioration that yields a March 6 breakdown. 2100 sets up at the 50% Fibonacci retracement, highlighting its importance as price pulls back and tests support twice (1,2) before the final high print and three times afterward (3,4,5). In turn, these five tests establish a broader support zone between 2100 and 2105 (blue lines). The contract rallies to a four-day high (6) after the fifth test and sells off, establishing the first lower high since Feb. 20. This is a classic sign of weakness, as outlined in the Dow Theory more than 100 years ago. Although originally observed in the DJ Industrial and Railroad Averages, it works exceptionally well as a signal generator, on both intraday and daily futures charts.
The lower high gives way to a sell-off (7) that breaks through the support zone. First violations rarely lead to instant trend changes in the futures markets because algorithms that dominate Globex prefer to clean out order volume on both sides before entering broad directional impulses. This bias contributes to a short squeeze above the support zone (8) that attracts aggressive selling pressure and a deeper low (9) in the following session. That low tests the February swing low (red line) and finds support at the 0.786 retracement. The contract bounces to support one last time and prints two failed tests (10,11) before rolling over in a breakdown that accelerates when it undercuts the prior lows, dropping another 20 points in four hours.
The event timeline illustrates how S&P 500 price action aligns with key macro impulses, often on the other side of the planet. This tells the observant trader to pay close attention to economic and political catalysts when institutional capital is likely to execute the most aggressive strategies. It is also highly instructive when bullish news such as ECB qualitative easing and strong U.S. jobs data fails to push the contract above a broken support level, as it did on March 5 and 6.
In Summary
The S&P 500 index futures contract works exceptionally well as a road map for short-term market timing and direction. Watch the 24-hour, 60-minute chart as it builds support and resistance levels, aligning risk exposure with testing that follows market-moving economic and political events.
Alan Farley can be contacted on this link: Hard Right Edge
Last edited by a moderator:
