Trading Naked - Part 2

The problem with trying to catch tops and bottoms is many a time while you are waiting for it it hit a price it turns some distance before it hits the tops/bottoms. Its best to be aware to take action around the region rather than a top/bottom price.

(This talk of tops/bottoms almost sounds sexual:LOL:)

LOL - very true Gamma. It can also be the over way around too, it can reverse after it's passed the S/R slightly! Bit of a pain but if you target the best 5-15m candles like pin bars I'm sure you can catch them. This is what I'm trying to find out. (y)

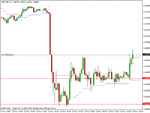
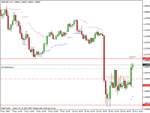
On the subject of this matter, I've noticed the best S/R reversal setups seem to come when the 4H trend into it contained a lot of medium sized candles with small reversals against the trend. When there are few candles and they all seem to be bigger than the rest, it shows that decisions are being made and it's probably in the direction of the trend not against it!!
 

Attachments

  • Tues10Nov09-SetupAnalysisGBP4H.jpg
    Tues10Nov09-SetupAnalysisGBP4H.jpg
    186.7 KB · Views: 132
  • Tues10Nov09-SetupAnalysisGBP5m.jpg
    Tues10Nov09-SetupAnalysisGBP5m.jpg
    130.1 KB · Views: 142
hi Hawk,

I was just to lazy to elaborate.
But basically what you say above is the way, set an alert by the price you are interested in, then switch to a lower time frame, and keep an eye on the action.
Its also worthwhile keeping an eye on fib ratios that might coincide.
 
Hi Owain,

Just looking at the M5 chart and it looks to me like one of those mornings for sitting on hands whilst the story unfolds. One thing your recent posts have reinforced to me is the power of levels to reverse the direction of price. As a quick exercise I've just drawn on all the intraday levels and, as yet, there doesn't look like there's much space left for price to run.

Looking at the chart I am reminided of something TheBramble wrote once about the decision to take a trade always remaining the responsibility of the individual trader - i.e. just because the set-up is there one doesn't have to take it. It's always stuck in my mind.

Anyway UK news out at 9.30am. The nice thing about consolidations followed by breakouts is that, unless the breakout is massive, M5 will tend to give a nice 1-2-3 set-up following the breakout to jump on the bus (albeit a bit late).

Just my 2 cents, and we are now guaranteed to to see a breakout, with a 250 pip move with no M5 consolidation ;-)

All the best

Rob
 
Last edited:
HaHa

Completely agree, drop down to the hourly chart and it just looks ugly as well. You could have nicked a few ££ if you were very quick on the exit but too choppy at the moment.
 
Some will be selling this I guess and some will be waiting on the other side to buy it.......

View attachment 67980

N.B. No requirement for anything other than a few lines.......

A bit of thinking aloud regarding this chart from yesterday evening. It's a classic case IMO of why something Gamma said over the weekend is so important, and that is to have a plan. A big level that broke up then broke down. Was there any way to protect against losing if one went long? Well possibly if one had set as entry rules to trade in on M5 and trail aggressively under M5 swing lows to break even and then just sit, watch and wait?

I think this may have been what Andy was getting at yesterday?

gbpusd - 091109 m5 i.gif
 
Hi Owain,

Just looking at the M5 chart and it looks to me like one of those mornings for sitting on hands whilst the story unfolds. One thing your recent posts have reinforced to me is the power of levels to reverse the direction of price. As a quick exercise I've just drawn on all the intraday levels and, as yet, there doesn't look like there's much space left for price to run.

Looking at the chart I am reminided of something TheBramble wrote once about the decision to take a trade always remaining the responsibility of the individual trader - i.e. just because the set-up is there one doesn't have to take it. It's always stuck in my mind.

Anyway UK news out at 9.30am. The nice thing about consolidations follwoed by breakouts is that, unless the breakout is massive, M5 will tend to give a nice 1-2-3 set-up following the breakout to jump on the bus (albeit a bit late).

Just my 2 cents, and we are now guaranteed to to see a breakout, with a 250 pip move with no M5 consolidation ;-)

All the best

Rob

Hi Rob,

I concur re TheBramble, each setup is different to each trader, one mans trash is another mans treasure, etc.

Is it me or is the 5m consolidation on Cable really tight? I've never seen it so tight for a long time. I'm expecting some false breakouts.
 
Hi Rob,

I concur re TheBramble, each setup is different to each trader, one mans trash is another mans treasure, etc.

Is it me or is the 5m consolidation on Cable really tight? I've never seen it so tight for a long time. I'm expecting some false breakouts.

This is just a purely personal opinion, which should count for nothing, but yesterday (and to an extent the Asian session as well) were big win sessions when she was trending beautifully, levels being respected etc., etc. The more I trade her the more I tend to look on bad following on from good in sofaras, the money could be made yesterday, but given back today. I, personally, am sitting on my hands today unless she settles down a bit. I've had far too many good weeks turn sour through a desire to trade taking over from a desire to make money... To me, the consolidation looks OK - nothing to untoward. It's just the effect that this consolidation might have on my capital that worries me!!

As I say, that's a purely personal view and there will probably now be a massive breakout and I'll end up looking like a mug!!
 
P.S. One thing that may be worth looking out for is a defined trend starting on M1 or M5 between 9.20am and 9.29am - sometimes she tips her hand early......
 
" P.S. One thing that may be worth looking out for is a defined trend starting on M1 or M5 between 9.20am and 9.29am - sometimes she tips her hand early...... "

:)
 

Attachments

  • visiible-in-tea-leaf-reading.jpg
    visiible-in-tea-leaf-reading.jpg
    85.7 KB · Views: 192
  • teacup.jpg
    teacup.jpg
    64.5 KB · Views: 170
  • Lol.jpg
    Lol.jpg
    84.1 KB · Views: 154
i'll get out at the first whiff of a reversal at the red line.
 

Attachments

  • cable.gif
    cable.gif
    17 KB · Views: 179
HawkTrader, since you asked for comments on your strategy in post #181 and your strategy. That of course can work, but an immediate problem that jumps out at me from it is:

See if you think this level will break or hold.

That is the type of thing that would make me unsure of entry.

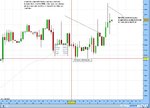
Also looking at your graph, you seem to be a bit inconsistent with the levels. The 16108 level was clear support becoming resistance, and it worked. It also coincided with a fib level pretty closely and worked superbly in fact. However, the 16252 level on your chart is definitely support, but you have to look pretty closely to see the previous resistance, because the resistance is there, but not so strong. Also even if you do take that line at 16252, the last swing up from it, didn't actually touch that line, so realistically would you have even got on board that one?

The second thing I would mention is that if you take the 16108 level, it was strong support, it broke through recently, came up tested it and went back down again. Compare that with your recent trade from the round number. Aside from the fact you admit it wasn't a strong level, is it the same situation? In the first case, price broke down, the most recent action was a big swing down, followed by a pullback to the SbR level. In the second case, price had broken up through a level, was heading strongly up, and was approaching a weak level.

Shouldn't you according to your strategy be actually looking to go long on a retracement rather than short?
 
HawkTrader, since you asked for comments on your strategy in post #181 and your strategy. That of course can work, but an immediate problem that jumps out at me from it is:


That is the type of thing that would make me unsure of entry.

Also looking at your graph, you seem to be a bit inconsistent with the levels. The 16108 level was clear support becoming resistance, and it worked. It also coincided with a fib level pretty closely and worked superbly in fact. However, the 16252 level on your chart is definitely support, but you have to look pretty closely to see the previous resistance, because the resistance is there, but not so strong. Also even if you do take that line at 16252, the last swing up from it, didn't actually touch that line, so realistically would you have even got on board that one?

Wow Shakone, thanks for your input, it's helped immensely and has got me thinking.

Regarding the 1.6252 level I did actually trade that but in demo, the difference being is that I entered about 2 hours before the 4H candle closed rather than the extreme low on the 5m example. I was simply trying to work out if it could be done better giving me a bigger edge and better R:R. I realise it's not a pivot S/R but it had been hit twice and bounced back consistently and I was working on the fact that it has a high probability of holding, but then of course it's different for each trader and some might argue 'the more it is tested the more likely to fail'.

The second thing I would mention is that if you take the 16108 level, it was strong support, it broke through recently, came up tested it and went back down again. Compare that with your recent trade from the round number. Aside from the fact you admit it wasn't a strong level, is it the same situation? In the first case, price broke down, the most recent action was a big swing down, followed by a pullback to the SbR level. In the second case, price had broken up through a level, was heading strongly up, and was approaching a weak level.

Shouldn't you according to your strategy be actually looking to go long on a retracement rather than short?

Funny you should mention that, I was going to include a trend following pullback setup into my method, but I thought for now I'd just stick to pure reversals. I'm working from the 'what goes up must come down' point of view. If I was to trade the 1.6108 level long I wouldn't be looking for as much profit as it's in the direction of the trend which would lower my R:R (arguably).

Quite simply I'm trying to get in as early as possible into the new trend at areas of high probabilty of turning, with low risk and big potential gains.

-Owain
 
Last edited:
Not quite the same as Rob's entry method but still Naked trading.

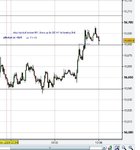
Quick 28pts on Cable. Entry at 16735, stop at 16725 Exit 16763.

Exit wasn't technical, price pushed through 50 level and stalled above 60, on a seemingly quiet morning there seemed a good chance of pullback so took profit. Could it have run for more, maybe but does it matter if there's a decent return locked in?
 

Attachments

  • cable1 11-11.jpg
    cable1 11-11.jpg
    122.5 KB · Views: 163
Top