Once in a while a pattern comes along discovered by little known trader that stood the test of time can be a useful tool to trade even in this modern-day markets. It only goes to show the validity of the pattern's profitability factor.
This is a complex pattern that beginners may have a hard time finding them in their charts. Identifying double-top, double-bottom, triangles are easy. Then head-and-shoulders come in many shapes and sizes, these take more time to spot them. But the Gartleys are more complex in a sense that Fibonacci measurements must be taken into account unlike the traditional patterns. This pattern is also known as the Gartley Butterfly because of the movements of the prices and the drawn lines that connect to other pivots to give what looks like wings of a butterfly.
Below is a sample of what a Gartley pattern looks like. It may look like the astronomy chart at first but with time, the pattern will clearly appear for opportunities to trade.
The pattern begins with pivot X. For longs, prices move up pivot X to A, then retraces back to B. From B, another price advance to C, not higher than A. From C, prices again move back to the D, above X but below B. This is pattern that resembles letter M. For the short Gartley, the pattern resembles a W.
Gartley is more than just prices moves up and down, Fibonacci measurements between these pivots are taken seriously into consideration. So finding the pattern that fits these criteria can be a cumbersome task.
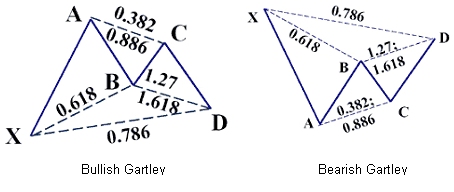
caption: Figure 1. Bullish Gartley pattern looking like M while bearish resembles a W. (chart courtesy of Investopedia.com).
The line AX is the highest high and the lowest low of the patterns. All the pivots that follow are within 100% measurement of AX. Pivot B usually sits between 38% and 62% of AX. Pivot D sits between 62% and 78% and must be below pivot B. Pivot C sits between 68% and 78% of XA line.
Here's an example:
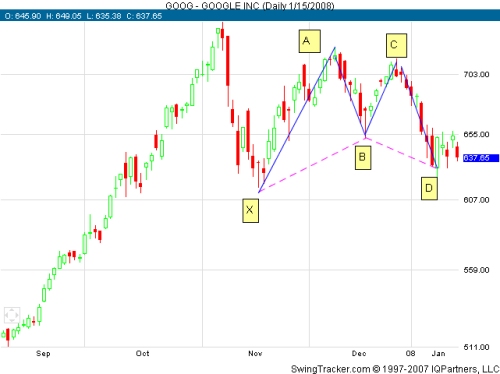
caption: Figure 2 GOOG exhibits what looks like a bearish Gartley Pattern.
GOOG made a big advance before stopping to consolidate in early November. Prices once again advanced but didn't even reach the last high before pulling down again. This time the move went below the last low.
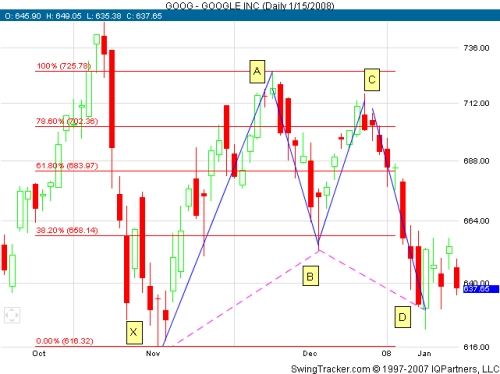
caption: Figure 3.
Figure 3 shows a close-up of the pattern from GOOG. With the Fibonacci and the pivots marked, the pattern becomes clearer. The blue lines indicates the path of the prices starting from X to A, B, C, then to D. Note that the pivot B stops just below 38.2%, this is right position. Then seeing that C is below A but above B while D is above X but above B. Pattern is complete. Since this is a bullish pattern, the prices are projected to move up higher than A. To be exact, the projected target is 127% of AD. In this scenario, GOOG is project to be completed at around 754.53.
As for the bearish Gartley pattern, the butterfly is turned upside down as shown in figure 4.
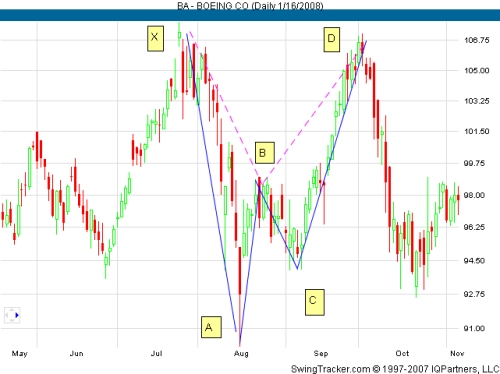
caption: Figure 4 A bearish Gartley pattern appeared during a consolidation period.
BA had been moving in a range following its advance. It finally capitulated at pivot X with a gap then proceeded lower to pivot A. It reversed to B; right between X and A. From there prices pulled back to C where again is half way from between B and A. From C, it completed the pattern by moving to D. With D near the X, but since it didn't go higher than X, the pattern was still valid. From there, prices proceeded to move down, with a projected target from Fibonacci measurements shown in Figure 5 below.
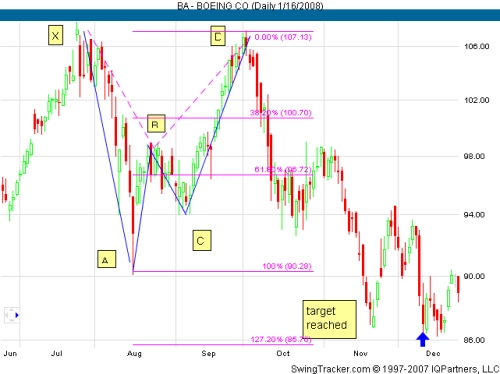
caption: Figure 5 The bearish pattern measured with Fibonacci grid to find the projected move.
The chart is zoomed in to illustrate the prices? movement upon completion of the pattern. From pivot D, prices moved quickly down past A and eventually meet the projected 127% extension level ($85.76). Considering the distance of the move from the top, this makes a very big profit (from $106 to $85) when the opportunity is present.
The Gartley pattern is used mainly by experienced veteran due to its complex use of price action and Fibonacci measurements to find the opportunity. It takes time to understand the pattern and use it on a regular basis. But their potential for profit is high so it's worth learning and using them.
This is a complex pattern that beginners may have a hard time finding them in their charts. Identifying double-top, double-bottom, triangles are easy. Then head-and-shoulders come in many shapes and sizes, these take more time to spot them. But the Gartleys are more complex in a sense that Fibonacci measurements must be taken into account unlike the traditional patterns. This pattern is also known as the Gartley Butterfly because of the movements of the prices and the drawn lines that connect to other pivots to give what looks like wings of a butterfly.
Below is a sample of what a Gartley pattern looks like. It may look like the astronomy chart at first but with time, the pattern will clearly appear for opportunities to trade.
The pattern begins with pivot X. For longs, prices move up pivot X to A, then retraces back to B. From B, another price advance to C, not higher than A. From C, prices again move back to the D, above X but below B. This is pattern that resembles letter M. For the short Gartley, the pattern resembles a W.
Gartley is more than just prices moves up and down, Fibonacci measurements between these pivots are taken seriously into consideration. So finding the pattern that fits these criteria can be a cumbersome task.
caption: Figure 1. Bullish Gartley pattern looking like M while bearish resembles a W. (chart courtesy of Investopedia.com).
The line AX is the highest high and the lowest low of the patterns. All the pivots that follow are within 100% measurement of AX. Pivot B usually sits between 38% and 62% of AX. Pivot D sits between 62% and 78% and must be below pivot B. Pivot C sits between 68% and 78% of XA line.
Here's an example:
caption: Figure 2 GOOG exhibits what looks like a bearish Gartley Pattern.
GOOG made a big advance before stopping to consolidate in early November. Prices once again advanced but didn't even reach the last high before pulling down again. This time the move went below the last low.
caption: Figure 3.
Figure 3 shows a close-up of the pattern from GOOG. With the Fibonacci and the pivots marked, the pattern becomes clearer. The blue lines indicates the path of the prices starting from X to A, B, C, then to D. Note that the pivot B stops just below 38.2%, this is right position. Then seeing that C is below A but above B while D is above X but above B. Pattern is complete. Since this is a bullish pattern, the prices are projected to move up higher than A. To be exact, the projected target is 127% of AD. In this scenario, GOOG is project to be completed at around 754.53.
As for the bearish Gartley pattern, the butterfly is turned upside down as shown in figure 4.
caption: Figure 4 A bearish Gartley pattern appeared during a consolidation period.
BA had been moving in a range following its advance. It finally capitulated at pivot X with a gap then proceeded lower to pivot A. It reversed to B; right between X and A. From there prices pulled back to C where again is half way from between B and A. From C, it completed the pattern by moving to D. With D near the X, but since it didn't go higher than X, the pattern was still valid. From there, prices proceeded to move down, with a projected target from Fibonacci measurements shown in Figure 5 below.
caption: Figure 5 The bearish pattern measured with Fibonacci grid to find the projected move.
The chart is zoomed in to illustrate the prices? movement upon completion of the pattern. From pivot D, prices moved quickly down past A and eventually meet the projected 127% extension level ($85.76). Considering the distance of the move from the top, this makes a very big profit (from $106 to $85) when the opportunity is present.
The Gartley pattern is used mainly by experienced veteran due to its complex use of price action and Fibonacci measurements to find the opportunity. It takes time to understand the pattern and use it on a regular basis. But their potential for profit is high so it's worth learning and using them.
Last edited by a moderator: