Trading ES (Q2 2004)

Do people find this thread useful?

  • waste of typing time. pls trade your ideas in silence :(

    Votes: 0 0.0%

  • Total voters
    34
60 min

a bit concerned with these higher highs increasing at same small increment - which is usually not too good for bulls. However, macd is not making lower highs - equal rather - which is of coz STILL a neg div BUT think in these terms - ES is still travelling at same velocity with no acceleration or deceleration..... a true bear wud want 2 c deceleration really.

still convinced buying volatility on strangles at the recent dip in volatility is a good trade. my delta here is slighly negative and i like it this way :)
 

Attachments

  • cme-es04m- 60 minute.jpg
    cme-es04m- 60 minute.jpg
    67.2 KB · Views: 964
Off in a tangent

China, have you ever thought about using a point and figure Tick chart. I think it cuts out a lot of the noise but needs tweaking.
 

Attachments

  • dow 5min340.png
    dow 5min340.png
    45.9 KB · Views: 867
stop - excellent idea! i am not that fluent in P&F tho - can u quide me as to how it wud work on Tick? what time span wud a "circle" or "cell" (dont know the official name in P&F) represent?
 
60 min

now really interesting. look at macd - same velocity...
 

Attachments

  • cme-es04m- 60 minute.jpg
    cme-es04m- 60 minute.jpg
    64.5 KB · Views: 874
P&F

China

Reading up on P&F over the weekend. I suppose the idea is to try and eliminate random noise. I have given each unit a value of 100 ticks.

What I am looking for is new highs and new lows in the tick . You can also see support very clealy on this tick chart. Divergence is also there.

I am going to run both chart types over the next few weeks. I do believe it is worth investigating.
 

Attachments

  • dow 5min342.png
    dow 5min342.png
    54.4 KB · Views: 825
Tick P&F

I tried a 5 minute chart will a 100 tick box setting but found it too slow. The the one minute chart we too quick. The two minute chart with a 25 tick box size looks promising.
 

Attachments

  • dow 5min344.png
    dow 5min344.png
    45.4 KB · Views: 735
P&F 5 minute charts

Getting to grips with this P&F. Here are the plays.
 

Attachments

  • dow 5min346.png
    dow 5min346.png
    69.6 KB · Views: 741
Friday system choke

ok I have to admit the sys choked on Friday :mad: in the sense that from starters index crosses were up trend indicative, they were so at 10:30, 13:00 and strictly speaking even at 14:15 time pivots. XBD was hinting things were not that rosy :D - however, thats a secondary cross, and otherwise - it looked as a trend up day.

I was lucky in the sense that I smelled something was rotten, like on that super spike on March 5th before open - sold my1150 June calls right when options opened and entered into a short futures position, essentially doubling my Short from the puts.

I am still convinced index crosses r key in determining how the session will evolve, but I now have 2 sessions this yr so far (friday and that march 5 spike) when trading on them wud be suicidal. Well 2 muck-ups in 70 sessions is not that bad :cheesy: but def food for more thought.

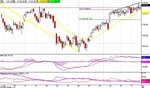
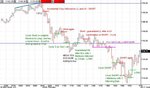
ALSO - once I noticed that i shorted exactly where "dark siders" wud short (see chart) I tried to keep an eye on their line of thinking throughout the day. I AM IMPRESSED!!! And my hat off to Skim and others :cheesy: I am NOT YET a dark sider and perhaps will never be one, since I see the power of Tick divs and MACD (thx to voodoo) - but from now on I will def use the "dark side" as AT LEAST an extra comfo for my trades. Thx to all u lads and lasses :idea:

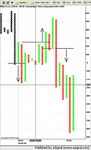
Look at how point fat the day was:
 

Attachments

  • cme-es04m- 5 minute (all sessions).jpg
    cme-es04m- 5 minute (all sessions).jpg
    55.5 KB · Views: 717
nice post china - must admit, the dark side looks more and more attractive ....
 
China, I am new to this board and would be grateful if you could point me to where I can look up your terms such as HL, HH and Maribozu. Also, who are the "dark siders" and where can I read about them. Thanks.
 
RT, HL = Higher Low, Higher High - All TA related.

Maribozu is a type of candle / bar in charting.

look thru this site or pick up a TA book or browse the web - here's a good site :


http://www.spytrdr.com/charts/

scroll to the bottom for TA
 
China, if u have some spare time, can u talk a little about index crosses and how u use them to determinetrend and non-trend days pls?

Cheers
 
very ruffly mate - if comp/dow and ndx/spx > 2:1 its trend. if on top secondary crosses sox/comp and xbd/spx show leadership - u've got full house :)
 
The geometry siders on the above link use price action around key sacred geometric levels...The market moves in ratio's of degrees.. Eg..The mesured move is a basic example of a Unity ratio of 1:1... Its the price action around these ratio's we focus on....So maybe in skims definition were not dark sidersafter all ?? :cheesy:

CJ
 
Last edited:
System Choke

China, Like you said 2 out of 70 is not bad.
Maybe it's just a case of remembering to tread carefully making a trend call when it's the result of a big opening gap?

hampy
 
China just want to make sure that I have got it right.
When you mention 2:1 ratio's, it is the %increase/decrease you are referring to and not number of points.

ie comp up 1% cf dow 0.4%
 
of coz mate its %. a Dow point in general is a dubious thing to me as Dow is price weighed. There is that Danish shipping company listed only on the danish exchange called "something... 1912" (cant recall exactly) with the share price of 800 bucks - if it was on the Dow, it'd be the biggest weight there, the whole bloody index wud've bn moved by that one company! :) an absurd example I agree - but hv u noticed how Dow moves became much more reasonable after MMM split? prior to that when MMM was trading at above 100 bucks and was the biggest weight on Dow, Dow moves were not broad market moves but MMM individual story rather :)

btw for index crosses - to be entirely logical :) - u want to compare Comp/SP500 and NDX/SP100.
 
Top