Tick & Trin

Marky Suree

Newbie
Messages
4
Likes
0
trick & trin

Hi im new to trading can anyone explain how trick and trin indicators work or recommend a book/website that will, as i'm slightly confused about how they work .

thanks
 
I think you might mean $TICK .

Measures the number of NYSE stocks currently trading on an up-tick (higher transaction price than the preceding transaction) against those trading on a down-tick.

+/-300 = Neutral
+/-1000 = Excessively Bullish/Bearish.


TRIN (also known as ARM's Index)

Formula is:-

Advancing Issues/Declining Issues
......................................................
Advancing Volume/Declining Volume

A rising TRIN is normally taken as short-term Bearish, falling TRIN is short-term Bullish.

HTH
 
btw, if you're completely new to trading, T&T probably isnt the best thing to start with.

Try getting into some basic TA first - use the First Steps Forum threads - then once you're a bit more up on things, delve a little deeper.

RR
 
Which is a good site to find these measurements during the day, when markets are opened ?
 
Some thing to look at

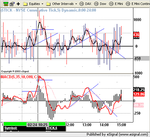
Tick and Trin. I remenber asking about that. Rossored is correct learn basic TA first and then work out how to read price and volume. The Tick can then be used as a filter. I had a look at the Trin. Although it is a good tool, the Tick gives you much better readings. If any thing, the $Tick used in conjuction with the $Prem could be a better combination.
 

Attachments

  • dow 5min237.png
    dow 5min237.png
    65.7 KB · Views: 840
This is my first post here so excuse the simple question .

Where can I get the tick and trin in real time ?? Quote.com doesn't have real time even though it claims to be - there is a 15 min delay .
This link below seems to be realtime but my I can't use this at work because of firewall ! It works at home though .
http://www.snappytrader.com/ta/ticktrin.htm

My broker - Ameritrade - does not offer this at all .

Can anyone help ??
Thanks
 
Tick!

Yes,

I know, stupid question. But I have been looking at charts and would like to know, what is a tick? Presumably some measurement of time, but how much?

Thanks for being patient.

demag.
 
demag.......a tick is the smallest price change of a financial instrument, i.e. in FTSE it would be: 0.5 points.

What you may see on a chart that displays a tick chart is: not a measurement of time but rather of ticks. e.g. a tick chart (20 ticks for example) is a bar showing the range of the last 20 changes in price, so therefore it is not a measurement of time.
 
Top