Yes as well as that calc I have 3 other Independent cycles spinning out in 2034 - March/June & final top will be in NOV'34, then big bear market
Still got 9 years to wait!!!!!!!!!!!!!!!!!!!!!!!!!!!!!!!!!!!!!!!!!!!!!!!!!!!!!!!!
These posts will be well and truly lost by thénar
You are using an out of date browser. It may not display this or other websites correctly.
You should upgrade or use an alternative browser.
You should upgrade or use an alternative browser.
THT
Active member
- Messages
- 233
- Likes
- 100
Well its fairly well established that Israel, is on a mission
Russian drones have also landed in Poland - NATO territory!
It's going to be Interesting to see what comes of all this as it is all brewing up
I've known about the war cycle since the 2010's - when you first see the prediction, you think "maybe", then when you get closer to the time and you start seeing all the unrest and fighting, it really brings it home, how remarkable all this is - the cause of all this was shown on page 10 of this thread
At some point the USA won't be able to remain outside of the game
On the Vuelta we've had many stages shortened due to protesting Pro-Palestine supporters - There is a cycling team on the Vuelta that is called "Israel........" hence the protests! How the organisers failed to think that this would not attract the type of person to protest is beyond me, it was a nailed on certainty as soon as the Israel team we named to participate in race
This was a serious consideration that we thought of in advance, but we decided to take the risk even if the whole race was cancelled, because we are in Rioja region and could easily convert the tour into a wine tour if forced to
This is what happens in life, people fail to think through scenarios or fail to plan effectively, if you do this in the markets, you get taught a costly lessons
Anyhow, going forward, its obvious that the expected Oct'25 LOW will not be a laboured out affair now, it will either be a plunge or more likely some sort of timid correction - a sideways market is perfectly fine
My gut feeling says timid correction, rally up somehow into the "BEAST" cycle dates of Spring 2026 and then the fun and games will begin, if the war cycle kicks in at this time too, it is going to be very very volatile - we can't predict exactly the war cycle, we just have the open window around its exact date of July 2026 - We also have some "internal" planetary cycles due in 2026 too, which have been shown to you months ago on the charts that contain the Oct 2025 low expectation
Sideways markets that get nowhere I class personally as BEARISH - Its just something I tend to do to label the bull/bear cycles, to make sense of the cycles
Markets tend to go sideways when the bull phases pause - Think the period 1966-1982, that was a down section, but the markets just went sideways, that tells you that the BIGGER cycle was PAUSING, hence the sideways action, then on the smaller cycles you had bear markets etc - see how it all fits in
I've shown you this sideways pausing on various time-frames
The main USA markets NATURAL DIRECTIONAL movement that is HAS to go is UPWARDS - this is why over 200+ years its transcended UPWARDS, its a continually evolving and GROWING entity
That does NOT mean, it will not suffer from a 1929 type flush out, because it will - that happened in 2000 on the Nasdaq - the next flush out is decades away and I reckon I'll of popped my clogs by then anyway
Getting better and better here ….🙏❤️🎯…spring 2026and July 2026….noted…one important question about Gold and the cycle that fall in April 2026, it should be only a bottom or cycle can be inverted and be a low? 🙂 many thanks, M.Well its fairly well established that Israel, is on a mission
Russian drones have also landed in Poland - NATO territory!
It's going to be Interesting to see what comes of all this as it is all brewing up
I've known about the war cycle since the 2010's - when you first see the prediction, you think "maybe", then when you get closer to the time and you start seeing all the unrest and fighting, it really brings it home, how remarkable all this is - the cause of all this was shown on page 10 of this thread
At some point the USA won't be able to remain outside of the game
On the Vuelta we've had many stages shortened due to protesting Pro-Palestine supporters - There is a cycling team on the Vuelta that is called "Israel........" hence the protests! How the organisers failed to think that this would not attract the type of person to protest is beyond me, it was a nailed on certainty as soon as the Israel team we named to participate in race
This was a serious consideration that we thought of in advance, but we decided to take the risk even if the whole race was cancelled, because we are in Rioja region and could easily convert the tour into a wine tour if forced to
This is what happens in life, people fail to think through scenarios or fail to plan effectively, if you do this in the markets, you get taught a costly lessons
Anyhow, going forward, its obvious that the expected Oct'25 LOW will not be a laboured out affair now, it will either be a plunge or more likely some sort of timid correction - a sideways market is perfectly fine
My gut feeling says timid correction, rally up somehow into the "BEAST" cycle dates of Spring 2026 and then the fun and games will begin, if the war cycle kicks in at this time too, it is going to be very very volatile - we can't predict exactly the war cycle, we just have the open window around its exact date of July 2026 - We also have some "internal" planetary cycles due in 2026 too, which have been shown to you months ago on the charts that contain the Oct 2025 low expectation
Sideways markets that get nowhere I class personally as BEARISH - Its just something I tend to do to label the bull/bear cycles, to make sense of the cycles
Markets tend to go sideways when the bull phases pause - Think the period 1966-1982, that was a down section, but the markets just went sideways, that tells you that the BIGGER cycle was PAUSING, hence the sideways action, then on the smaller cycles you had bear markets etc - see how it all fits in
I've shown you this sideways pausing on various time-frames
The main USA markets NATURAL DIRECTIONAL movement that is HAS to go is UPWARDS - this is why over 200+ years its transcended UPWARDS, its a continually evolving and GROWING entity
That does NOT mean, it will not suffer from a 1929 type flush out, because it will - that happened in 2000 on the Nasdaq - the next flush out is decades away and I reckon I'll of popped my clogs by then anyway
THT
Active member
- Messages
- 233
- Likes
- 100
Getting better and better here ….🙏❤️🎯…spring 2026and July 2026….noted…one important question about Gold and the cycle that fall in April 2026, it should be only a bottom or cycle can be inverted and be a low? 🙂 many thanks, M.
July 26 is the war cycle which has a wide window, we're already seeing the effects of the war cycle with everything that's been going on since 2022 - the only thing you can do with the war cycle is wait until the USA get dragged into physical action, when that happens the stock markets will crash, then rebound - other than that you just use the date to watch for war as well as defence stocks etc
I don't track Gold, I should look at it more in-depth at some stage though
April 2026 lines up with the Spring BEAST cycle - the BEAST cycle is ALWAYS some sort of swing high - the APRIL'26 is an Internal cycle and can be either a high or a low, I just list the dates, to prove beyond doubt that A) You can predict the market and B) Time the market throughout the 18 year UP cycle to 2034
ALL cycles can Invert, although as of yet the BEAST cycle hasn't done so - It's easy to spot Inversions as say you're waiting for a 4 year low to come in and in the months/year before its due, the market has just been rallying upwards, you can pretty well determine an inversion is happening and the big money is made on the bigger cycles
I've shown this before, but you can see the Inversions - The last one in 2020 should have been an extreme high, it was obvious a low was forming
Thank you boss…🙂 these my chart of corn…how Mans days between each circle please?July 26 is the war cycle which has a wide window, we're already seeing the effects of the war cycle with everything that's been going on since 2022 - the only thing you can do with the war cycle is wait until the USA get dragged into physical action, when that happens the stock markets will crash, then rebound - other than that you just use the date to watch for war as well as defence stocks etc
I don't track Gold, I should look at it more in-depth at some stage though
April 2026 lines up with the Spring BEAST cycle - the BEAST cycle is ALWAYS some sort of swing high - the APRIL'26 is an Internal cycle and can be either a high or a low, I just list the dates, to prove beyond doubt that A) You can predict the market and B) Time the market throughout the 18 year UP cycle to 2034
ALL cycles can Invert, although as of yet the BEAST cycle hasn't done so - It's easy to spot Inversions as say you're waiting for a 4 year low to come in and in the months/year before its due, the market has just been rallying upwards, you can pretty well determine an inversion is happening and the big money is made on the bigger cycles
I've shown this before, but you can see the Inversions - The last one in 2020 should have been an extreme high, it was obvious a low was forming
View attachment 343450
Attachments
THT
Active member
- Messages
- 233
- Likes
- 100
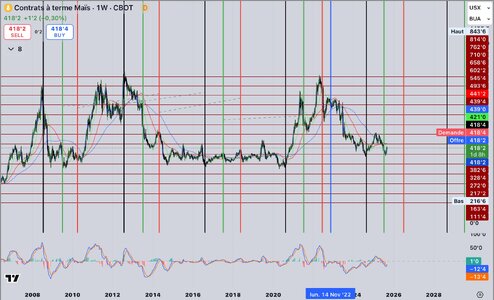
Thank you boss…🙂 these my chart of corn…how Mans days between each circle please?
Its a "variable" 4 YEAR cycle - which means its not exact or static and its an average
Don't try to be exact - just knowing the cycle exists and then applying trend qualifiers to watch out for reversals in the direction of the expected cycle is perfectly good enough, as most people trading it, won't be aware of the cycle - 4 years is approx 208 WEEKS but it can be +/- around that period of time
If you want to get slightly better confirmation, watch the COT Indicators (commitment of traders report) as you will find in 90%+ of cases the COMMERCIALS (smart money) will be NET LONG (accumulating positions) near the lows and then when they [the commercials] go NET SHORT, that is usually when prices start to rise as the smart money starts off loading their accumulations to traders, fuelling the price rise etc
I wrote about the COT on page 2
THT
Active member
- Messages
- 233
- Likes
- 100
OK I'm back home - well that certainly was an interesting Vuelta!
At the Vuelta (I actually thought this would have happened at the Tour De France but it didn't! It would of had much more impact for the protestors if it had of, but that's an opportunity missed for them), we had mass protests at points throughout the tour routes by Pro-Palestine protestors
Because there's a team named "Israel....." - It was virtually guaranteed to happen and it did, with a couple of stages cancelled for the cyclists safety, the final stage saw some ugly fighting in Madrid, but on the whole it was a peaceful protest(s) at the horror that Israel is inflicting upon and within Gaza
Its obvious that the USA are staying silent on the matter and Israel are hell bent of flattening Gaza - The UN yesterday said Genocide was occurring, which has been evident for months
It is absolutely sickening to see it unfold, the irony is, that Israel have capitalised upon the horrors of World War II against the Jewish people, only to now do similar to the people of Palestine and Gaza, but rather than gassing them, they are using missiles, bombs and bullets to drive them out - truly sad and horrific, to which the world will remember!
Anyway, we all know why this is happening, its because the 84 year Uranus war cycle is repeating - previously showed you the following chart a month or so ago:
Its WHY we are seeing an increase and uprising of RIGHT WING thinking, protests and rallies around the world - its simply repeating the mind-set that it caused 84 years back in the 1940's and we all know what creature of evil that created!
you ALWAYS have a "period of Influence" either side of the exact date and that is what is happening right now, with Israel, hell bent of revenge at all costs and assignations in the USA etc
UK military planes are now in Poland to defend Polish airspace
Something will tip and then you'll see the involvement of the USA somehow, still waiting on this though

So to the markets
This is what the stats are showing:
These 2 next charts fit into the Oct'25 low thinking, how it pans out is anyone's guess


See what happens
Seasonal charts are from Jake Bernstein's Seasonaltrader.com
PS - If you are at all Interested in understanding why world events seem to happen out of the blue, in an Illogical manner, I would trace where the money comes from, in the UK at the weekend there were mass patriotic rallies by a right wing thug and his pals, yet he is "funded" by our friends of Israel! You might not believe in or like conspiracy theories, but so far on most things David Icke has been right
Just this week we had "50 [USA] states AND Israel" standing together at a conference! - Up until the current Chairman of the FED reserve, ALL previous chairpersons were Jewish - It's all hidden in plain sight, but devious enough to be "layered"
Delve into who actually "funds" your local politician or member of parliament, it might be revealing
At the Vuelta (I actually thought this would have happened at the Tour De France but it didn't! It would of had much more impact for the protestors if it had of, but that's an opportunity missed for them), we had mass protests at points throughout the tour routes by Pro-Palestine protestors
Because there's a team named "Israel....." - It was virtually guaranteed to happen and it did, with a couple of stages cancelled for the cyclists safety, the final stage saw some ugly fighting in Madrid, but on the whole it was a peaceful protest(s) at the horror that Israel is inflicting upon and within Gaza
Its obvious that the USA are staying silent on the matter and Israel are hell bent of flattening Gaza - The UN yesterday said Genocide was occurring, which has been evident for months
It is absolutely sickening to see it unfold, the irony is, that Israel have capitalised upon the horrors of World War II against the Jewish people, only to now do similar to the people of Palestine and Gaza, but rather than gassing them, they are using missiles, bombs and bullets to drive them out - truly sad and horrific, to which the world will remember!
Anyway, we all know why this is happening, its because the 84 year Uranus war cycle is repeating - previously showed you the following chart a month or so ago:
Its WHY we are seeing an increase and uprising of RIGHT WING thinking, protests and rallies around the world - its simply repeating the mind-set that it caused 84 years back in the 1940's and we all know what creature of evil that created!
you ALWAYS have a "period of Influence" either side of the exact date and that is what is happening right now, with Israel, hell bent of revenge at all costs and assignations in the USA etc
UK military planes are now in Poland to defend Polish airspace
Something will tip and then you'll see the involvement of the USA somehow, still waiting on this though
So to the markets
This is what the stats are showing:
These 2 next charts fit into the Oct'25 low thinking, how it pans out is anyone's guess
See what happens
Seasonal charts are from Jake Bernstein's Seasonaltrader.com
PS - If you are at all Interested in understanding why world events seem to happen out of the blue, in an Illogical manner, I would trace where the money comes from, in the UK at the weekend there were mass patriotic rallies by a right wing thug and his pals, yet he is "funded" by our friends of Israel! You might not believe in or like conspiracy theories, but so far on most things David Icke has been right
Just this week we had "50 [USA] states AND Israel" standing together at a conference! - Up until the current Chairman of the FED reserve, ALL previous chairpersons were Jewish - It's all hidden in plain sight, but devious enough to be "layered"
Delve into who actually "funds" your local politician or member of parliament, it might be revealing
Last edited:
THT
Active member
- Messages
- 233
- Likes
- 100
Not sure If I've shown this before or not
My friends are NOT traders - they are more position based Investors, I sent this one out to them just before I headed out to the Tour de France and they got in on it because it made sense to them, purely because the stock was at rock bottom prices
They just bought blindly because it made sense - I doubt they have set a stop either!
Let me stage the analysis so it makes sense to you
Markets at some point in their life will base - it could be on any or multiple time-frames
This one was/is on the WEEKLY time-frame, which is perfect for base builder Investors looking to hold for months/years
BASE BUILDING - GOING SIDEWAYS for MONTHS
At some point is WILL breakout and notice the muted decline in March 2025, as the world markets plunged = BULLISH

So with a BASE, we want an idea of the rally potential - the potential as a minimum is that the HEIGHT = the WIDTH
Now I can't draw squares wth this charting software, so I have to draw an approx circle and then refine thereafter - the circle height will be the same length as its width - See we're using part of that high school maths you thought was useless knowledge

Now to avoid scaling issues, I have to create lines on the chart around the circle, as once I rescale the page view on my screen, the size of the circle is going to change and we don't want that, so I simply use a Gann Box to do that

Then I can delete the circle
Now I can either add horizontal lines or I can copy the Gann Box across
By using the Gann Box, I can now if I wish, use the ANGLES of the Gann Box as a trailing stop or whatever - the choice is there

Now if I zoom out to add more price action and time to the chart, I can see prior price history
I can also stack the Gann Boxes on top of each other and see where 2 or 3 times the height of the box lies in terms of price levels, that we might be able to use in the future

It will be Interesting to see the different personalities of my friends with this stock, because, they are all very different people and its going to be interesting seeing who holds the longest and the reasons - 1 of them is already out, he made circa 30% and for him that was enough as he's convinced everything is going to the dogs when war gets stronger, so its a bit of a social experiment for me watching
Obviously, I'm not going to let them loose, I've Insisted they use a hard stop of 100p, as it makes absolutely no sense letting a winning position turn negative, but I can't force them, some will listen to me and some I know will think they can outsmart the game - I'll assist those still in the position with logical stop placement along the way according to their outlooks
You can use whatever analysis methods make sense to YOU
The above concept came to me years ago, I was reading Dr Van Tharps "Trade your way to Financial Freedom" and in that book he referred to a Ken Roberts 123 pattern - That's the same 123 formation I've previously mentioned throughout this thread - anyhow,
I googled Ken Roberts, found his book below and on about page 110 he shows the basing method - I think he wrote the book in the mid 1980's, worth getting hold of

My friends are NOT traders - they are more position based Investors, I sent this one out to them just before I headed out to the Tour de France and they got in on it because it made sense to them, purely because the stock was at rock bottom prices
They just bought blindly because it made sense - I doubt they have set a stop either!
Let me stage the analysis so it makes sense to you
Markets at some point in their life will base - it could be on any or multiple time-frames
This one was/is on the WEEKLY time-frame, which is perfect for base builder Investors looking to hold for months/years
BASE BUILDING - GOING SIDEWAYS for MONTHS
At some point is WILL breakout and notice the muted decline in March 2025, as the world markets plunged = BULLISH
So with a BASE, we want an idea of the rally potential - the potential as a minimum is that the HEIGHT = the WIDTH
Now I can't draw squares wth this charting software, so I have to draw an approx circle and then refine thereafter - the circle height will be the same length as its width - See we're using part of that high school maths you thought was useless knowledge
Now to avoid scaling issues, I have to create lines on the chart around the circle, as once I rescale the page view on my screen, the size of the circle is going to change and we don't want that, so I simply use a Gann Box to do that
Then I can delete the circle
Now I can either add horizontal lines or I can copy the Gann Box across
By using the Gann Box, I can now if I wish, use the ANGLES of the Gann Box as a trailing stop or whatever - the choice is there
Now if I zoom out to add more price action and time to the chart, I can see prior price history
I can also stack the Gann Boxes on top of each other and see where 2 or 3 times the height of the box lies in terms of price levels, that we might be able to use in the future
It will be Interesting to see the different personalities of my friends with this stock, because, they are all very different people and its going to be interesting seeing who holds the longest and the reasons - 1 of them is already out, he made circa 30% and for him that was enough as he's convinced everything is going to the dogs when war gets stronger, so its a bit of a social experiment for me watching
Obviously, I'm not going to let them loose, I've Insisted they use a hard stop of 100p, as it makes absolutely no sense letting a winning position turn negative, but I can't force them, some will listen to me and some I know will think they can outsmart the game - I'll assist those still in the position with logical stop placement along the way according to their outlooks
You can use whatever analysis methods make sense to YOU
The above concept came to me years ago, I was reading Dr Van Tharps "Trade your way to Financial Freedom" and in that book he referred to a Ken Roberts 123 pattern - That's the same 123 formation I've previously mentioned throughout this thread - anyhow,
I googled Ken Roberts, found his book below and on about page 110 he shows the basing method - I think he wrote the book in the mid 1980's, worth getting hold of
THT
Active member
- Messages
- 233
- Likes
- 100
OK
Back to normality - I wasn't going to share this, but have decided to


I've mentioned Walter Bressert numerous times - Its up to you to research him if interested - As you can see he was light years ahead of most traders and investors 30+ years ago! and I bet most traders/Investors are still light years behind the times still
I really would love to see what would happen If the stock market just did not always go upwards - people would be forced to get real with what is actually going on in the markets, unfortunately, as the market just goes upwards over the long term, people just sleep walk into Investments
right in the chart above:
You know my thoughts on the BEAST cycle due Spring'26
I have also shown Larry Williams 4 year OCT cycle low previously - this would be [IS] due in OCT 2026 as well
So we have some nice timing coming up
You can see the average % move following the 4yr cycle low - the leaders move more than this remember!
and if you trade, you also have a pretty clear road map for years of what to expect and we all know you only make money by trading in the direction that prices move in
Lets see what actually happens
The ideal situation is UP into Spring 2026, crash into the 4 year cycle low and then it will be up again to some degree
As ever - trade at your own research and discretion as YOU are 100% liable for all trading results including losses
Back to normality - I wasn't going to share this, but have decided to
I've mentioned Walter Bressert numerous times - Its up to you to research him if interested - As you can see he was light years ahead of most traders and investors 30+ years ago! and I bet most traders/Investors are still light years behind the times still
I really would love to see what would happen If the stock market just did not always go upwards - people would be forced to get real with what is actually going on in the markets, unfortunately, as the market just goes upwards over the long term, people just sleep walk into Investments
right in the chart above:
- GREEN line = the AVERAGE 4 year cycle
- The RED line is the ACTUAL 4 year cycle LOW and
- The BLUE line is the AVERAGE low to High cycle
- The Indicator catches the turns, but its the TIMING BAND on the Indicator that is the Important bit
- The TIMING BAND covers the period of time in the tables for low to low and is displayed as bands overlapping and the DATES are shown on the RIGHT hand side of the Indicator window
You know my thoughts on the BEAST cycle due Spring'26
I have also shown Larry Williams 4 year OCT cycle low previously - this would be [IS] due in OCT 2026 as well
So we have some nice timing coming up
You can see the average % move following the 4yr cycle low - the leaders move more than this remember!
and if you trade, you also have a pretty clear road map for years of what to expect and we all know you only make money by trading in the direction that prices move in
Lets see what actually happens
The ideal situation is UP into Spring 2026, crash into the 4 year cycle low and then it will be up again to some degree
As ever - trade at your own research and discretion as YOU are 100% liable for all trading results including losses
Thanks a lot 🙂 I’m waiting for 7000 and 7450 …they are both important but specially the 7400-7500OK
Back to normality - I wasn't going to share this, but have decided to
View attachment 343664
View attachment 343665
View attachment 343666
View attachment 343667
I've mentioned Walter Bressert numerous times - Its up to you to research him if interested - As you can see he was light years ahead of most traders and investors 30+ years ago! and I bet most traders/Investors are still light years behind the times still
I really would love to see what would happen If the stock market just did not always go upwards - people would be forced to get real with what is actually going on in the markets, unfortunately, as the market just goes upwards over the long term, people just sleep walk into Investments
right in the chart above:
So we now have some dates for the next 4 year cycle LOW - As you can see that is anytime NOW through to mid 2026
- GREEN line = the AVERAGE 4 year cycle
- The RED line is the ACTUAL 4 year cycle LOW and
- The BLUE line is the AVERAGE low to High cycle
- The Indicator catches the turns, but its the TIMING BAND on the Indicator that is the Important bit
- The TIMING BAND covers the period of time in the tables for low to low and is displayed as bands overlapping and the DATES are shown on the RIGHT hand side of the Indicator window
You know my thoughts on the BEAST cycle due Spring'26
I have also shown Larry Williams 4 year OCT cycle low previously - this would be [IS] due in OCT 2026 as well
So we have some nice timing coming up
You can see the average % move following the 4yr cycle low - the leaders move more than this remember!
and if you trade, you also have a pretty clear road map for years of what to expect and we all know you only make money by trading in the direction that prices move in
Lets see what actually happens
The ideal situation is UP into Spring 2026, crash into the 4 year cycle low and then it will be up again to some degree
As ever - trade at your own research and discretion as YOU are 100% liable for all trading results including losses
Hi THT, how are you? I am a new member to the forum and a fellow Gann aficionado. I have done some significant research on Gann's FTT - worked it out to 2050 (it is more precise than what appears on the outset - natal based). I do not mind sharing, appreciate it if you could PM me. Thanks.Some of you would of heard of of legendary traders such as WD Gann and Jesse Livermore - I'll show you how they both traded in later posts - For the time being, lets stick with WD Gann..........................
You can do your own research on Gann, the Important bit is that he blew his trading accounts up by the early 1900's - Then he made some amazing discoveries, these discoveries were research into the planets and seeing if they sync'd with the financial markets - to save you a HUGE amount of time and effort, Gann wrote a number of trading courses/manuals etc and had basic ones and truth ones - the truth ones he forced buyers to sign a non-disclosure agreement and very very very little exists of the true courses he wrote. In his basic courses, some versions mention the planets and his Soybeans 1948 Mars/Jupiter chart and his Coffee Santos letter are both available online to see, other than these 2 bits, very little exists - Gann hid the true meaning of everything in his basic courses, so when he says "The 30 year cycle....." He means Saturn cycle etc, but piecing it all together is hard and I'm pretty sure something is missing because its not a simple piece together
This knowledge is Important, as once you start Gann, you'll spend many a year researching going around and around in circles!
So back in 1909, yes 1909, WD Gann produced the following table:
View attachment 332692
Take a couple of minutes to pick out some dates - SOME (not all) were spot on predictions
Its not 100%, but I wanted to show you what Gann was doing over a century ago in his quest for what the markets are/were doing
This is a 18.6 year cycle and to save you the hassle of working out what relevance that is, its the North Node of the MOON cycle - which when you force it into a sine wave type cycle it creates a up/down sequence, which fits pretty well (not exact though) into the ups and downs of the stock market
On the matter of the Moon - If you think Stonehenge was built for ancient sacrifices and whatnot, do some research on its remarkable positioning with the Sun and Moon, the Saros cycle etc - The true reason Stonehenge was built was written in a book in the 1960's by Gerald Hawkins - Definitely worth buying a copy/read
Its Important you recognise the trends and how everything fits into them - Its pretty clear by now that the stock markets are on some sort of journey which is EVER UPWARD
So if we (YOU) can isolate those periods of TIME which are going to be big bear markets, then you WILL BE ABLE TO PREDICT the UP sections - and trade/Invest accordingly - I'm not going to do that for you, just know that its possible - those of you that want to learn will do so and those of you that don't wish to, won't bother
The chart below shows 3 of those 16-19 yr cycle periods I posted in the 1st post, the sequence here is DOWN then UP then DOWN - Not all cycles are shown, rest assured the BIG lows inc 1987 all have cycles in the sequence
Notice during the 2 DOWN cycles - The BLACK cycle line timed the mid cycle HIGHS perfectly - you could make a fortune just off that once every 32-35 year shorting opportunity
As you can see I published this chart months before (I'd sat on producing the chart since 2012) the August 2015 date - Go look what the UK and USA markets did on that EXACT day!
The RED cycle line starts or ends the big 16-19 year BULL/UP section/cycle
View attachment 332695
Within those big cycles, you also have INTERNAL cycles, here's a YEARS before the event prediction, to prove its not pie in the sky mumbo jumbo stuff:
View attachment 332696
They don't also create big moves, the key aspect is being aware and ready and if a decent plunge happens into the date, then you're looking to take a long position etc
Any professional trader would never blindly trade a cycle date, you'd wait for confirmation etc
I'm quite happy to share this basic info - Don't ask for anymore detailed analysis though, as I'm not prepared to share everything I have
Remember, you do not need to know all this stuff to win at trading - but it massively helps - I'm just showing you that the markets are not some random movement of prices, that there's a structure to it all in BOTH TIME & PRICE
If you KNOW that something like 2009* is (should) going to happen, then you don't need to know price levels and if you know the price level something should happen at, you don't need to know the time/date - you just wait for the turn on the date or price level and follow
* The only time in 200 years that the likes of 1974 or 2009 didn't happen as it should was in the civil war of the USA in the mid 1800's, when the country was being rebuilt and huge sums of govt money were thrown into the economy to get it going and rebuilt again
I'll show you examples of this in the next posts, but you can see what I mean by the 2015 prediction and the 2020 one - I doubt there were that many people that predicted that
Staying on the theme of WD Gann and his cycles - in his basic courses, he says things like "Project 90 degrees (veiled planetary reference), hours, days, weeks, months, years to get the next turn" - In Gann language 90 = 90 degrees of the SQUARE, which it is geometrically
Gann worked on the basis that everything squares itself, hence his Gann angles, they move an angle at a set rate of points per bar and when time and price balance or square, then reversals HAVE to happen
You'd spend a lot of time monitoring everything Gann told you to watch and you'd never know what was going to happen - This is why you have to always look BACK in TIME to see if anything happened that length of TIME AGO
In 2023 there was a brief Banking crisis, with a USA bank going bust, it made the news - Now go back 90 years from 2023 and again etc and see if any other "Banking Crisis's" happened around those dates in the past!
You'll see there were, so we can confidently PREDICT that in the year (or very close years around) 2113 that there should be some sort of issue with a bank or multiple banks around that TIME
This all shows you that TIME is patterned and the upshot of that, is that if that is true, then our life paths can't be as free willed as we're led to believe/understand
THT
🙏🙏🙏👏👏👏OK
Back to normality - I wasn't going to share this, but have decided to
View attachment 343664
View attachment 343665
View attachment 343666
View attachment 343667
I've mentioned Walter Bressert numerous times - Its up to you to research him if interested - As you can see he was light years ahead of most traders and investors 30+ years ago! and I bet most traders/Investors are still light years behind the times still
I really would love to see what would happen If the stock market just did not always go upwards - people would be forced to get real with what is actually going on in the markets, unfortunately, as the market just goes upwards over the long term, people just sleep walk into Investments
right in the chart above:
So we now have some dates for the next 4 year cycle LOW - As you can see that is anytime NOW through to mid 2026
- GREEN line = the AVERAGE 4 year cycle
- The RED line is the ACTUAL 4 year cycle LOW and
- The BLUE line is the AVERAGE low to High cycle
- The Indicator catches the turns, but its the TIMING BAND on the Indicator that is the Important bit
- The TIMING BAND covers the period of time in the tables for low to low and is displayed as bands overlapping and the DATES are shown on the RIGHT hand side of the Indicator window
You know my thoughts on the BEAST cycle due Spring'26
I have also shown Larry Williams 4 year OCT cycle low previously - this would be [IS] due in OCT 2026 as well
So we have some nice timing coming up
You can see the average % move following the 4yr cycle low - the leaders move more than this remember!
and if you trade, you also have a pretty clear road map for years of what to expect and we all know you only make money by trading in the direction that prices move in
Lets see what actually happens
The ideal situation is UP into Spring 2026, crash into the 4 year cycle low and then it will be up again to some degree
As ever - trade at your own research and discretion as YOU are 100% liable for all trading results including losses
Had to sign up to say what an incredible thread. Thank you.
As we're in the zone for the potential October cycle low, it would be interesting to understand how to interpret the current bullish market action. Is there any way to identify when a cycle might be inverting versus not really having much impact? Or is that something that only becomes apparent after the event?
As we're in the zone for the potential October cycle low, it would be interesting to understand how to interpret the current bullish market action. Is there any way to identify when a cycle might be inverting versus not really having much impact? Or is that something that only becomes apparent after the event?
THT
Active member
- Messages
- 233
- Likes
- 100
Had to sign up to say what an incredible thread. Thank you.
As we're in the zone for the potential October cycle low, it would be interesting to understand how to interpret the current bullish market action. Is there any way to identify when a cycle might be inverting versus not really having much impact? Or is that something that only becomes apparent after the event?
Hi Thanks
This OCT LOW HAS - HAS to be a low - it can't be a high - and it doesn't have to land bang on the date either
This could just be a very light/timid correction, it doesn't have to be that significant - the Important part is the Spring BEAST cycle next year, that is always a HIGH and we have the expected 4 year LOW cycle due too, so its getting Interesting
The low could be anything - timid sideways move, plunge etc - it can't be known I'm afraid
There is another cycle playing out that has a low in DEC'25 - It is perfectly feasible for the 2 to sync up and have a low Nov/Dec time
Don't get hung up on this OCT'25 cycle - its just the mid point in the whole entire overall cycle
INVERSION - YES (sorry to shout!) STATIC CYCLES often Invert, so when you are watching a static cycle expecting say a LOW and price is rocketing upwards significantly into date or vice versa - its obvious (see the corn chart below clearly shows Inversion points
With PLANETARY cycles, due to what the planets are doing up there, apart from a few that are nailed on, most can be highs or lows, this is not ideal, because we are committing money etc
In the chart below the BLUE Inversion, most likely would of caught you out - The LOW came a couple of months before the date, so you'd of been in a long trade expecting big moves - This is why you have to use stops - Once price closed BELOW the prior major swing low, it was clear after the fact of the Inversion - I've shown this because this one broke the rules of Inversions, but in reality what happened was the cycle came in AFTER the actual date but I would class it as an Inversion and failed cycle move
Move onto the low of 2020 and that was a clear cut Inversion
So, Its just a common sense judgement call - If a market is making new major HIGHS and you're expecting a low, the probability of an Inversion is high, just watch for trend qualifiers that signal a bear market
This is the markets - never say never, expect the worse and have a plan for it, that's all you can do
If I've not answered your question, let me know and I'll try to explain it different
But its essential to know I don't show everything on here, some cycles are set in stone, some are variable/dynamic and some are temporary, which means they show up and then disappear!
Let me find a chart with a clear Inversion
Notice that on this OIL market - the cycles are clear but price action can be a bit "iffy" - This is just one of those things and is why we don't blindly buy
Hi Thanks
This OCT LOW HAS - HAS to be a low - it can't be a high - and it doesn't have to land bang on the date either
This could just be a very light/timid correction, it doesn't have to be that significant - the Important part is the Spring BEAST cycle next year, that is always a HIGH and we have the expected 4 year LOW cycle due too, so its getting Interesting
The low could be anything - timid sideways move, plunge etc - it can't be known I'm afraid
There is another cycle playing out that has a low in DEC'25 - It is perfectly feasible for the 2 to sync up and have a low Nov/Dec time
Don't get hung up on this OCT'25 cycle - its just the mid point in the whole entire overall cycle
INVERSION - YES (sorry to shout!) STATIC CYCLES often Invert, so when you are watching a static cycle expecting say a LOW and price is rocketing upwards significantly into date or vice versa - its obvious (see the corn chart below clearly shows Inversion points
With PLANETARY cycles, due to what the planets are doing up there, apart from a few that are nailed on, most can be highs or lows, this is not ideal, because we are committing money etc
In the chart below the BLUE Inversion, most likely would of caught you out - The LOW came a couple of months before the date, so you'd of been in a long trade expecting big moves - This is why you have to use stops - Once price closed BELOW the prior major swing low, it was clear after the fact of the Inversion - I've shown this because this one broke the rules of Inversions, but in reality what happened was the cycle came in AFTER the actual date but I would class it as an Inversion and failed cycle move
Move onto the low of 2020 and that was a clear cut Inversion
View attachment 343917
So, Its just a common sense judgement call - If a market is making new major HIGHS and you're expecting a low, the probability of an Inversion is high, just watch for trend qualifiers that signal a bear market
This is the markets - never say never, expect the worse and have a plan for it, that's all you can do
If I've not answered your question, let me know and I'll try to explain it different
But its essential to know I don't show everything on here, some cycles are set in stone, some are variable/dynamic and some are temporary, which means they show up and then disappear!
Let me find a chart with a clear Inversion
Notice that on this OIL market - the cycles are clear but price action can be a bit "iffy" - This is just one of those things and is why we don't blindly buy
View attachment 343918
That's excellent and clarifies well. Thanks.
I'm not too hung up on the current Oct cycle. It just happens to be timely (well, maybe). The inversion possibility was the only question that remained.
The market has been moving strongly, so I'm looking forward to seeing what plays out relative to anticipated cycles. The way things repeat/rhyme is all the evidence I need to suggest that cycles are a thing. You can't look at a BTC chart without thinking of Gold in the 70s.
THT
Active member
- Messages
- 233
- Likes
- 100
That's excellent and clarifies well. Thanks.
I'm not too hung up on the current Oct cycle. It just happens to be timely (well, maybe). The inversion possibility was the only question that remained.
The market has been moving strongly, so I'm looking forward to seeing what plays out relative to anticipated cycles. The way things repeat/rhyme is all the evidence I need to suggest that cycles are a thing. You can't look at a BTC chart without thinking of Gold in the 70s.
Nothing moves parabolic indefinitely - and when it ends all that energy forces sideways to down recovery until the next move
If we had got freely traded gold prices pre 1970's, we'd of been able to work out exactly what its game is
China has been amassing huge amounts of physical gold - countries don't do that for fun - so there's going to be some sort of story there in the future
Have a good weekend
10 of October 2025….precise like a Swiss clock….🙂 Thanks boss..🙂 pleasure to read you …🙂🙏🙏🙏👏👏👏
THT
Active member
- Messages
- 233
- Likes
- 100
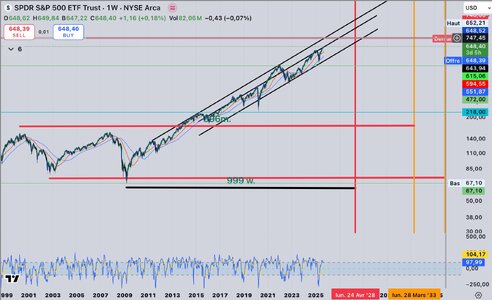
I've said it before when PRICE stops and reverses within 1 point of PERFECT GEOMETRY you need to sit up and listen
Second chart zooms in on the price and level
These are EXTERNAL/REVERSE RATIOS off significant swing points from the 2009 LOW!!!!!!!!!!!!!!!!!!!!!!!!!!!!!!!!!!!!!!!!!!!!!!!!!!!!!!!!!!!!!!!!!!!!!!!!!!!!!!!!!!!
Throughout this thread I have showed you the importance of GEOMETRICAL RATIOS and levels
This market just stopped dead on a key ratio of the FEB'20 HIGH and the 2009 LOW swing
2.236 is the SQ ROOT of 5 - Sq Root of 5 and therefore 2.236 is the length of the DIAGONAL of 2 ADJACENT SQUARES
THT
Active member
- Messages
- 233
- Likes
- 100
There you go
Nothing spectacular, but as predicted - we got a swing low!
Next up is the short-term SP500 cycle low due in DEC'25 - you can short that down into the low and then up out of the low with a solid trading plan/method - I'm not showing that in advance, we'll look at it after the fact
The expectation is that Dec'25 low will take us up into the BEAST 666 Spring'26 HIGHS, then down into the 4 year low cycle - That's just an expectation at this stage, it might not pan out quite as easy as that, What we do know is that beast cycle and the 4 year cycle have a 100% hit record covering 230 years of Dow Jones price data
Thought I would focus in on this chart below which shows the swing low
With most of these internal planetary cycles, you don't know what is coming, whether its going to be severe or mild - I'm just showing you we can time the markets
Go look at the Internals of that swing low and it will show uptrending confirmations - you have to trade what you see and not what you think
On that very subject [Trade what you see, not what you think] - Notice the RSI divergence, sometimes that turns out to coincide with a reversal of decent size, as in this case, not much - If you traded it, you need to work out the probability of it working and if you're happy with it, go for it, if not, then you need to rethink and use it accordingly
Also look at Jake Bernstein's price predictor published a few posts ago [#208] - It showed up and although we had the dip, its followed its expectation - Jake base's that graph on what price has ACTUALLY done over the last 50-100 years during those months in question, so you get a probabilistic outlook

Don't blindly trade things you don't understand - if in doubt, stay out
Nothing spectacular, but as predicted - we got a swing low!
Next up is the short-term SP500 cycle low due in DEC'25 - you can short that down into the low and then up out of the low with a solid trading plan/method - I'm not showing that in advance, we'll look at it after the fact
The expectation is that Dec'25 low will take us up into the BEAST 666 Spring'26 HIGHS, then down into the 4 year low cycle - That's just an expectation at this stage, it might not pan out quite as easy as that, What we do know is that beast cycle and the 4 year cycle have a 100% hit record covering 230 years of Dow Jones price data
Thought I would focus in on this chart below which shows the swing low
With most of these internal planetary cycles, you don't know what is coming, whether its going to be severe or mild - I'm just showing you we can time the markets
Go look at the Internals of that swing low and it will show uptrending confirmations - you have to trade what you see and not what you think
On that very subject [Trade what you see, not what you think] - Notice the RSI divergence, sometimes that turns out to coincide with a reversal of decent size, as in this case, not much - If you traded it, you need to work out the probability of it working and if you're happy with it, go for it, if not, then you need to rethink and use it accordingly
Also look at Jake Bernstein's price predictor published a few posts ago [#208] - It showed up and although we had the dip, its followed its expectation - Jake base's that graph on what price has ACTUALLY done over the last 50-100 years during those months in question, so you get a probabilistic outlook
Don't blindly trade things you don't understand - if in doubt, stay out
Similar threads
- Replies
- 2
- Views
- 4K
- Replies
- 5
- Views
- 3K
- Replies
- 101
- Views
- 148K