THT's Methods that WIN

  • Thread starter Thread starter THT
  • Start date Start date
  • Watchers Watchers 13
Some of you will dismiss this Instantly - that's your prerogative

Some of you will take the information and think deeply about your life on this Earth and it should evoke some deep consideration - you are "free" to some extent, but you're not free enough to be able to avoid being affected by major events - Who avoided "covid"? That was another expected cycle that is set in stone

This is bordering upon Astrology, but really its Astronomy - Astrology is guessing this and that, Astronomy simply takes planet positions and looks for coincidences

We are just looking for periods of times that a planet has been in a GEOMETRIC position around a circle

Seems that the USA likes to get involved in wars when Uranus is forming 90 degree points within a circle

The X and ARROW were drawn a couple of years ago when I sent this to a friend

1448.JPG


This is why for the past few years we've heard and witnessed war around the world

So far the USA has NOT directly got involved, if this cycle is to remain a 100% hit rate then the USA HAS to get involved in some conflict by 2030 ish

Its support or Israel and Ukraine are "technically" involved, but and I don't say this lightly, boots on the ground are needed for this cycle and that will invariably result in needless loss of American lives

Anyway, you've got to be a pretty hardened sceptic to say there's not a link between that planet at those positions and American involvement in major wars, because the evidence is staring you right in the face - people might not want to believe or accept it, that does not mean the coincidence is not there

PS - The image above was produced in 1993 - you need to add the 2nd gulf war onto the image which sits right with the 27 Aquarius position along with the End of WW1 at the top left corner of the square

You now have the ability to PREDICT EVERY future war that the USA decides to poke its nose into - just keep on adding 90 degrees to each position and you'll be there or there abouts

I can tell you for a fact - Those planets are not up there for no reason!

PPS - here's an image of Gann's Emblem / lines he used to draw on his square of nine and 24 etc

Gann Emblem.JPG

Now I don't know what will trigger war, I just know we are right in the zone - its a fairly wide window, but still, we have a lot of past factual coincidences that simply cannot be ignored

Just yesterday in the EU - the EU Presidents plane was targeted by software jamming tech and the whole of the EU alerted hospitals to prepare for war standing and the EU came out and mentioned supporting Ukraine in its war effort with troops on the ground, backed up by USA troops!

If you forward project this cycle, just remember that planets do not orbit around the sun in a perfect circle, sometimes there's slow and fast periods, so the 90 degs won't be linear - just like the Earth, our seasons aren't equal distances apart, there's a slight variance in days which is due to the orbit not being a perfect circle

Ganns Emblem shows the circle being split at perfect ideal points - in the real world, this doesn't happen, you just find the last occurrence of a major event and use that as a starting point, which is why the square in the circle from the 1993 publication is skewed from a perfect example
 
Some of you will dismiss this Instantly - that's your prerogative

Some of you will take the information and think deeply about your life on this Earth and it should evoke some deep consideration - you are "free" to some extent, but you're not free enough to be able to avoid being affected by major events - Who avoided "covid"? That was another expected cycle that is set in stone

This is bordering upon Astrology, but really its Astronomy - Astrology is guessing this and that, Astronomy simply takes planet positions and looks for coincidences

We are just looking for periods of times that a planet has been in a GEOMETRIC position around a circle

Seems that the USA likes to get involved in wars when Uranus is forming 90 degree points within a circle

The X and ARROW were drawn a couple of years ago when I sent this to a friend

View attachment 343327

This is why for the past few years we've heard and witnessed war around the world

So far the USA has NOT directly got involved, if this cycle is to remain a 100% hit rate then the USA HAS to get involved in some conflict by 2030 ish

Its support or Israel and Ukraine are "technically" involved, but and I don't say this lightly, boots on the ground are needed for this cycle and that will invariably result in needless loss of American lives

Anyway, you've got to be a pretty hardened sceptic to say there's not a link between that planet at those positions and American involvement in major wars, because the evidence is staring you right in the face - people might not want to believe or accept it, that does not mean the coincidence is not there

PS - The image above was produced in 1993 - you need to add the 2nd gulf war onto the image which sits right with the 27 Aquarius position along with the End of WW1 at the top left corner of the square

You now have the ability to PREDICT EVERY future war that the USA decides to poke its nose into - just keep on adding 90 degrees to each position and you'll be there or there abouts

I can tell you for a fact - Those planets are not up there for no reason!

PPS - here's an image of Gann's Emblem / lines he used to draw on his square of nine and 24 etc

View attachment 343328
Now I don't know what will trigger war, I just know we are right in the zone - its a fairly wide window, but still, we have a lot of past factual coincidences that simply cannot be ignored

Just yesterday in the EU - the EU Presidents plane was targeted by software jamming tech and the whole of the EU alerted hospitals to prepare for war standing and the EU came out and mentioned supporting Ukraine in its war effort with troops on the ground, backed up by USA troops!

If you forward project this cycle, just remember that planets do not orbit around the sun in a perfect circle, sometimes there's slow and fast periods, so the 90 degs won't be linear - just like the Earth, our seasons aren't equal distances apart, there's a slight variance in days which is due to the orbit not being a perfect circle

Ganns Emblem shows the circle being split at perfect ideal points - in the real world, this doesn't happen, you just find the last occurrence of a major event and use that as a starting point, which is why the square in the circle from the 1993 publication is skewed from a perfect example
Very interesting 🤔🙏🙏
 
  • Like
Reactions: THT
You can do the same with the financial markets

I can't give too much away but if you take a planet or planets from major turning points of the past, sift through various degrees to see if anything shows up

So these examples shows I produced these charts back in 2015 as per the YELLOW box

The RED boxes on the chart are TIMING only NOT price levels - All I did was take planets, used one of Ganns degrees from his emblem and then just REPEATED into the future the same number of degrees - so for example if this 1900 and a major price pivot occurred I might move the planet(s) by 90 or 120 degrees over and over and over into the future to see if anything hits

Lets get into the example so you can see - we take the 1st red box of the HIGH in 1966 in the chart immediately below and we move that forward x degrees (one of the numbers on Gann's Emblem), then we need to look at chart 2 to see if anything happened

SP500 1966-1982 - Copy.gif


So in chart 2 covering the 2000's - the 1st RED box is the period of time that the RED box from 1966 repeats - right at the 2000 highs!

So you REPEAT the sequence with the 2nd red box etc and just look at these hits

At the time I produced this chart example back in 2015, I was waiting for the 2015/16 date to form and as you can see price action had not completed, its easy enough to check what happened

SP500 2000-2017 - Copy.gif


If you go to page 1 of this thread you will see Aug 2015 date that caused the plunge too!

Now you might think you are living in a free world, but you're not, it's like the matrix movie - All we have to do is take those red boxes of the 2000's, apply the formula and we will have KEY MAJOR turning points on the SP500/NASDAQ etc in the future

Believe me I have the evidence and this stuff REPEATS back to the dows formation in 1792

Don't worry about 2009 - this was related to Gann's square of 12 (144) - I'm not a fan of the bible, but I think in the Book of Revelations it details the 12 tribes of Israel consisting of 12,000 men by 12,000 men = 144,000 - that was a direct nod to 144 and its multiples - note my logo, well that is a pentagram and the arms are 72 degrees apart, which is also part of the 144 sq of 12

This sequence can be a high or a low - it doesn't matter, you will know what's going on at the time

I know this is hard to believe

The easiest way to apply this is to see if I publish things at the time, if for whatever reason I don't then all you do is apply a STATIC time cycle zone of 33-35 years (typically 34 years) and you will be in the right area - this WILL get slightly out of sync though, because remember planets do not orbit the sun in a perfect circle and sometimes they are fast and other times slow when these calcs are hit

Now if you've remembered parts of this thread, I have previously mentioned for a long time to watch 2034 for the bull to end - this is based on something else, BUT, it also fits in with this particular cycle - So I have 2 separate planetary cycles warning of 2034 - the other method says it has to be a top, this method can be either a top or bottom, in the grand scheme of things, common sense says go with the top theory at this stage unless the market is a bear market come the 2034 date

Get a chart of the 1900-1920 period of time and then you can see the sequence in the charts above:
  • 1903 MAJOR LOW is linked to the 1937 HIGH which is linked to the 1969 HIGH which is linked to the 2002 LOW = The SAME planet(s), the SAME gann emblem degree repeated forward
  • 1907 MAJOR LOW is linked to: 1940L/1974L and 2007 High
So we can predict with high probability (not 100%), that the following should occur:
  • HIGH and FINAL TOP in 2034
  • BEAR market LOW in 2036, then
  • 2041 either a high or low
  • 2049 should be the final low followed by start of a NEW BIG bull market
These dates are approx/circa's - obviously trade/Invest at your own analysis and risk etc - I am not responsible for your decisions, all I'm showing you is the patterns and uniqueness of our universe

EDIT: if 2041 is a HIGH, then there WILL be MAJOR LOW in circa 2043, that will represent a fantastic buying point, I have NOT done the calcs for the 2034 period as yet, as I haven't been enthused to do so yet - 2043 (circa) is directly related to 2009

So, what about TODAY's market - well I have been yelling on here for quite some time, that we are in a big UP cycle until 2034

When the trend is up, you buy the pullbacks, which would of worked pretty well so far

You now know how to PREDICT WARS and some MAJOR stock market turning points, that will either END bull/bear markets and START bull/bear markets - then all you do is position yourself accordingly in the correct direction

Some people will have already seen the SIMILARITY in the shape of market direction in those 2 charts - they appear VERY VERY similar and that is because the planets are REPEATING the points of the circle that CREATE those emotional EXTREMES, they are bound to look similar - SIMILAR formation should appear in 2034+ Like I have said go look at a chart of the period 1900-1920 and you will SEE the market produced a similar formation!

We could move this sequence forward 500 years and if the USA still has stock markets then, then traders of those years will see the exact same repetition and similar formation as we have seen for the past 200+ years - ALL caused by the planets in our universe!

How amazing is that

PS - The FUND GROUPS know all of this, obviously they can't acknowledge it, doing so would destroy their businesses and this is just something that the masses will never ever hear about, understand or look into and the media will never give it serious space, because guess who spend a fortune in advertising spend per year? Yep the Fund groups!

Anyway, take it as you wish - those of you thinking deeply about it all this will be asking yourself is your life free or pre-planned out? I don't know the answer to that, I just know that those planets can be used to predict future events in wars, weather and financial markets from observing factual logical planetary positions against market turns that repeat over and over, beyond reasonable doubt to high probabilities - Astrology will have you applying assumptive guesswork and that in my opinion is where things can start to go wrong
 
You can do the same with the financial markets

I can't give too much away but if you take a planet or planets from major turning points of the past, sift through various degrees to see if anything shows up

So these examples shows I produced these charts back in 2015 as per the YELLOW box

The RED boxes on the chart are TIMING only NOT price levels - All I did was take planets, used one of Ganns degrees from his emblem and then just REPEATED into the future the same number of degrees - so for example if this 1900 and a major price pivot occurred I might move the planet(s) by 90 or 120 degrees over and over and over into the future to see if anything hits

Lets get into the example so you can see - we take the 1st red box of the HIGH in 1966 in the chart immediately below and we move that forward x degrees (one of the numbers on Gann's Emblem), then we need to look at chart 2 to see if anything happened

View attachment 343345

So in chart 2 covering the 2000's - the 1st RED box is the period of time that the RED box from 1966 repeats - right at the 2000 highs!

So you REPEAT the sequence with the 2nd red box etc and just look at these hits

At the time I produced this chart example back in 2015, I was waiting for the 2015/16 date to form and as you can see price action had not completed, its easy enough to check what happened

View attachment 343346

If you go to page 1 of this thread you will see Aug 2015 date that caused the plunge too!

Now you might think you are living in a free world, but you're not, it's like the matrix movie - All we have to do is take those red boxes of the 2000's, apply the formula and we will have KEY MAJOR turning points on the SP500/NASDAQ etc in the future

Believe me I have the evidence and this stuff REPEATS back to the dows formation in 1792

Don't worry about 2009 - this was related to Gann's square of 12 (144) - I'm not a fan of the bible, but I think in the Book of Revelations it details the 12 tribes of Israel consisting of 12,000 men by 12,000 men = 144,000 - that was a direct nod to 144 and its multiples - note my logo, well that is a pentagram and the arms are 72 degrees apart, which is also part of the 144 sq of 12

This sequence can be a high or a low - it doesn't matter, you will know what's going on at the time

I know this is hard to believe

The easiest way to apply this is to see if I publish things at the time, if for whatever reason I don't then all you do is apply a STATIC time cycle zone of 33-35 years (typically 34 years) and you will be in the right area - this WILL get slightly out of sync though, because remember planets do not orbit the sun in a perfect circle and sometimes they are fast and other times slow when these calcs are hit

Now if you've remembered parts of this thread, I have previously mentioned for a long time to watch 2034 for the bull to end - this is based on something else, BUT, it also fits in with this particular cycle - So I have 2 separate planetary cycles warning of 2034 - the other method says it has to be a top, this method can be either a top or bottom, in the grand scheme of things, common sense says go with the top theory at this stage unless the market is a bear market come the 2034 date

Get a chart of the 1900-1920 period of time and then you can see the sequence in the charts above:
  • 1903 MAJOR LOW is linked to the 1937 HIGH which is linked to the 1969 HIGH which is linked to the 2002 LOW = The SAME planet(s), the SAME gann emblem degree repeated forward
  • 1907 MAJOR LOW is linked to: 1940L/1974L and 2007 High
So we can predict with high probability (not 100%), that the following should occur:
  • HIGH and FINAL TOP in 2034
  • BEAR market LOW in 2036, then
  • 2041 either a high or low
  • 2049 should be the final low followed by start of a NEW BIG bull market
These dates are approx/circa's - obviously trade/Invest at your own analysis and risk etc - I am not responsible for your decisions, all I'm showing you is the patterns and uniqueness of our universe

EDIT: if 2041 is a HIGH, then there WILL be MAJOR LOW in circa 2043, that will represent a fantastic buying point, I have NOT done the calcs for the 2034 period as yet, as I haven't been enthused to do so yet - 2043 (circa) is directly related to 2009

So, what about TODAY's market - well I have been yelling on here for quite some time, that we are in a big UP cycle until 2034

When the trend is up, you buy the pullbacks, which would of worked pretty well so far

You now know how to PREDICT WARS and some MAJOR stock market turning points, that will either END bull/bear markets and START bull/bear markets - then all you do is position yourself accordingly in the correct direction

Some people will have already seen the SIMILARITY in the shape of market direction in those 2 charts - they appear VERY VERY similar and that is because the planets are REPEATING the points of the circle that CREATE those emotional EXTREMES, they are bound to look similar - SIMILAR formation should appear in 2034+ Like I have said go look at a chart of the period 1900-1920 and you will SEE the market produced a similar formation!

We could move this sequence forward 500 years and if the USA still has stock markets then, then traders of those years will see the exact same repetition and similar formation as we have seen for the past 200+ years - ALL caused by the planets in our universe!

How amazing is that

PS - The FUND GROUPS know all of this, obviously they can't acknowledge it, doing so would destroy their businesses and this is just something that the masses will never ever hear about, understand or look into and the media will never give it serious space, because guess who spend a fortune in advertising spend per year? Yep the Fund groups!

Anyway, take it as you wish - those of you thinking deeply about it all this will be asking yourself is your life free or pre-planned out? I don't know the answer to that, I just know that those planets can be used to predict future events in wars, weather and financial markets from observing factual logical planetary positions against market turns that repeat over and over, beyond reasonable doubt to high probabilities - Astrology will have you applying assumptive guesswork and that in my opinion is where things can start to go wrong
Yes …honestly I’m very impressed..🙂 for sure I will read these part many times…🙏🙏🙏big thanks boss..🙂
One more thing if a low is linked to,a high, 2002 low +33 = 2035 for a top) ? 🙏🙏🙏
 
  • Like
Reactions: THT
Yes …honestly I’m very impressed..🙂 for sure I will read these part many times…🙏🙏🙏big thanks boss..🙂
One more thing if a low is linked to,a high, 2002 low +33 = 2035 for a top) ? 🙏🙏🙏

Hi YES - Its actually a different method to calculate it, but all these things are linked and connect at key points

The TOP is coming in 2034, not 2035, but the main thing is YOU are prepared for a major top around the years 2034/2035 - 99.9% of people out there won't have a clue and will get dragged down into a bear market

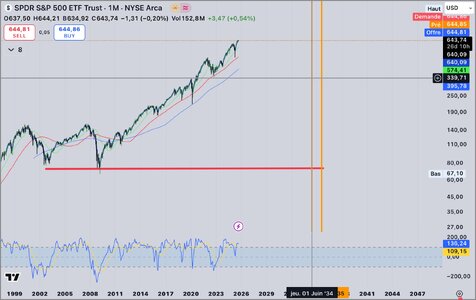
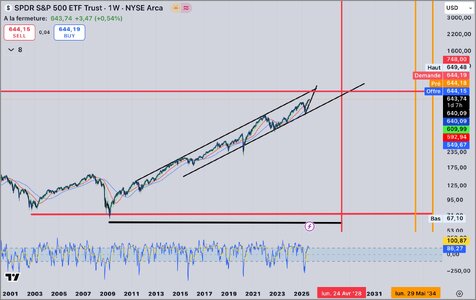
The 2034 top is most likely going to be a double top as well - because the 2 cycles that cause the turn BOTH hit in 2034 - these cycles, although not disclosed, are shown on page 1 of this thread covering a period from 1962 to 2015 which I posted on Jan 16th 2024, hidden in plain sight, that most people would have simply just skipped over, marking it as irrelevant

A key thing to get out of this, is the fact that those 16-19 year SIDEWAYS movements of the markets are regular, repeated and can be timed - which means all this can't be out of the blue economic reactions

If I'm still on here in the 2030's, I will publish the exact dates of all the major pivot swing points from 2034 going to 2050
 

Attachments

  • IMG_6659.jpeg
    IMG_6659.jpeg
    401.2 KB · Views: 5
  • Like
Reactions: THT
Saved ….🙂 thank you boss ..🙂 just hope we are all still alive by then…🤞🤞🤞🙏🙏🙏remember also 7450-7500…🙂 the boss knows why…
 
  • Like
Reactions: THT
On Jan 16th 2024 I posted a chart that shows the "framework" of planets [not disclosed] in relation to the SP500 and I referred to that post in a post yesterday on the 4th Sept 2025

The planet(s) used to calculate the times shown in post #183 published on Weds 3rd Sept 2025 just above - are DIFFERENT to those in the Jan 16th 2024 post (when I say different, I mean possible different planets and or differing degrees used to calculate etc)

When you get different planets landing at key timing zones, such as 1982/2000/2007/2015 etc the probabilities go through the roof because you have multiple planets working out their own geometric manoeuvres, that end up completing at certain points in time

The key to all this is just starting off with testing different combinations of the circle on as much data as you can obtain - 3 hits and its a possible contender to research further

It's really a reality shock to know that the extreme panic traders in 1907 traded under, is simply a repeatable pattern caused by the planets and that, that low in 1907 turned upside down into a top in 2007, some 100 years later - just truly amazing

It should be pretty obviously that during these 18 year sideways/down cycles you get 2-3 BEAR markets of significance, timing both the up and down internal cycles of it, can be done and you can make some pretty great returns throughout - depends on your greed levels

Think logically about it, you KNOW that in say 2002-2007 there should be a bull market of some degree, all you have to do is either track the SP500 or Nasdaq or find the individual shares within the USA markets that are moving WITH and in sync to the main market! If the main market moves 50%, the Individual shares that move WITH the market, have moved more than 50%!

Anyway, we have other planetary timing to watch out for in the short-term, 1st the Oct low expectation, followed in Spring 2026 by the "BEAST" 13 year cycle - this always causes turmoil and falling markets to some degree - how far down, its impossible to gauge, sometimes like 1987 you get a massive straight line plunge and then other times like 2013, you just get a sideways trading range

Time will tell
 
Lets continue with the hocus pocus ground breaking time prediction theme

If you don't, won't or can't refer to Gann's works, then you'll just have to take my word on his works - I really would try to obtain as cheaply as possible his works, he was light years ahead of his time

This is Gann's SQUARE of 9 [NINE]

The top block 1-9 are quite simply the planets - don't worry about that for now

Notice we rotate clockwise throughout and around the centre #1 - this spiral will go on forever

Then we can see that we can split this number pattern by various angles - this example below shows the numbers split by 22.5 degree segments as shown by the angles

The SECOND Gann Sq of 9 shows the numbers split by 45 degree angles - you can use what you like - all Gann did was split the circle of 360 degs by HARMONIC amounts which resulted in various angles being produced

You should also notice that these Sq's of 9's If converted into 3 dimensions, would represent a pyramid - that my friends was its true concept and explains that the pyramids in Egypt aren't just there for tourists!

Square of 9.JPG


Sq 9.png


So to keep this simple, Gann told us count x minutes/hours/days/weeks/months and years from major pivot points and that is what we will do

I want to keep this as simple as possible, because once you start mixing numerous concepts together its very easy to get lost in the process - just bear in mind that Gann used this Sq of 9 for price levels, time counts, planetary time, planetary degrees etc

It is ALSO a SQUARE ROOT CALCULATOR!

Take ANY number - say 474 get its square root = 21.771, then ADD 2 = 23.771 and square that number (23.771 times 23.771) = 565

You will notice that 565 is DIRECTLY ABOVE the number 474

If you want to get the number that is 180 degrees away from 474 then you'd just ADD 1 rather than 2 and re square = 518

Hopefully you should be able to see the order to all this and if the planets are causing these number's to happen, the grand order going on in our universe - worth pausing for thought here about that!

Keeping with the simple theme, lets explore this on the SP500 Index

This IS a cherry picked example, to show you

Lets take those MAJOR 45 degree angles of the circle shown on the Square of 9 and see if any of them coincide with any turning points on/in the market - We are for this example specifically looking for TIME

and by time I mean TIME in MONTHS from a major key pivot point in the market of the 2009 low point/date

so we are looking along the 45 diagonal angle (PINK DOTS) and the 270 straight angle (PINK DASHES)

1647.JPG


Here are those points as MONTHS shown on the chart

Not all are hits and there's some gaps, those gaps might be other numbers as months on some of the other major angles of the square of nine!

Anyway, the point is, there is a pattern here, that relates to months in TIME moving along key angles of a ordered number grid! and those turning points are made up of the combined motion in price and time of 500 Individual stocks, whose movements create the Index

1646.JPG


If you go back in this thread you will find the chart showing the 2022 high being 720 MONTHS on from the 1962 high - 720 months is 60 years but more Importantly it is TWICE around the full circle of 360 degrees

720 isn't on any major angle line, which shows you, you cannot just solely rely on number hits on these lines - the point of the post is to show you that at times, we can clearly see order to things, be prepared and ready - because most people out there will not be looking at this sort of thing

You will find that if you find a market resonates to TIME on particular angles, then PRICE will also resonate to those ANGLES - I showed you this in a previous post on the SP500 square of 9 for price action

If markets were random, then you should not be able to do that at all!

Don't get me wrong, this is not a one size fits all timing solution for every market, but the SP500 is working out well to the grey timing set shown which is the 270 deg angle of the sq9, the question is "Will the next on in the sequence work?"
 
Lets continue with the hocus pocus ground breaking time prediction theme

If you don't, won't or can't refer to Gann's works, then you'll just have to take my word on his works - I really would try to obtain as cheaply as possible his works, he was light years ahead of his time

This is Gann's SQUARE of 9 [NINE]

The top block 1-9 are quite simply the planets - don't worry about that for now

Notice we rotate clockwise throughout and around the centre #1 - this spiral will go on forever

Then we can see that we can split this number pattern by various angles - this example below shows the numbers split by 22.5 degree segments as shown by the angles

The SECOND Gann Sq of 9 shows the numbers split by 45 degree angles - you can use what you like - all Gann did was split the circle of 360 degs by HARMONIC amounts which resulted in various angles being produced

You should also notice that these Sq's of 9's If converted into 3 dimensions, would represent a pyramid - that my friends was its true concept and explains that the pyramids in Egypt aren't just there for tourists!

View attachment 343380

View attachment 343381

So to keep this simple, Gann told us count x minutes/hours/days/weeks/months and years from major pivot points and that is what we will do

I want to keep this as simple as possible, because once you start mixing numerous concepts together its very easy to get lost in the process - just bear in mind that Gann used this Sq of 9 for price levels, time counts, planetary time, planetary degrees etc

It is ALSO a SQUARE ROOT CALCULATOR!

Take ANY number - say 474 get its square root = 21.771, then ADD 2 = 23.771 and square that number (23.771 times 23.771) = 565

You will notice that 565 is DIRECTLY ABOVE the number 474

If you want to get the number that is 180 degrees away from 474 then you'd just ADD 1 rather than 2 and re square = 518

Hopefully you should be able to see the order to all this and if the planets are causing these number's to happen, the grand order going on in our universe - worth pausing for thought here about that!

Keeping with the simple theme, lets explore this on the SP500 Index

This IS a cherry picked example, to show you

Lets take those MAJOR 45 degree angles of the circle shown on the Square of 9 and see if any of them coincide with any turning points on/in the market - We are for this example specifically looking for TIME

and by time I mean TIME in MONTHS from a major key pivot point in the market of the 2009 low point/date

so we are looking along the 45 diagonal angle (PINK DOTS) and the 270 straight angle (PINK DASHES)

View attachment 343379

Here are those points as MONTHS shown on the chart

Not all are hits and there's some gaps, those gaps might be other numbers as months on some of the other major angles of the square of nine!

Anyway, the point is, there is a pattern here, that relates to months in TIME moving along key angles of a ordered number grid! and those turning points are made up of the combined motion in price and time of 500 Individual stocks, whose movements create the Index

View attachment 343383

If you go back in this thread you will find the chart showing the 2022 high being 720 MONTHS on from the 1962 high - 720 months is 60 years but more Importantly it is TWICE around the full circle of 360 degrees

720 isn't on any major angle line, which shows you, you cannot just solely rely on number hits on these lines - the point of the post is to show you that at times, we can clearly see order to things, be prepared and ready - because most people out there will not be looking at this sort of thing

You will find that if you find a market resonates to TIME on particular angles, then PRICE will also resonate to those ANGLES - I showed you this in a previous post on the SP500 square of 9 for price action

If markets were random, then you should not be able to do that at all!

Don't get me wrong, this is not a one size fits all timing solution for every market, but the SP500 is working out well to the grey timing set shown which is the 270 deg angle of the sq9, the question is "Will the next on in the sequence work?"
Add 45’ to the last blue line and you have the top in February 2025 at 190 bars….using 45 ‘ may be will give more opportunities…🙂 🙏🙏🙏197 bars give September 25….another one may be.
 
Back
Top