We all know emotion can be the devil in your trading career. Often, it is emotion based decisions that keep people from even having a trading career longer than a few months. While emotion often has you buying signals way after a move higher in price which is likely near resistance which almost ensures a losing trade, there is another culprit that leads to the same losing behavior in trading. It is the misuse of indicators and oscillators.
Understand that the movement in price in any and all free markets is a function of the pure laws and principles of supply and demand. Opportunity exists when this simple and straight forward relationship is out of balance, period. What most people don't understand is that when you ignore a governing dynamic that has been around longer than man has walked the earth, you are almost guaranteed a losing trading strategy. You can spend a lifetime attempting to come up with the perfect set of indicators and oscillators with the perfect set of inputs with hopes of attaining all the worlds' wealth and get nowhere. There is a reason for this which is the one thing you need to know about indicators and oscillators: They have NO IDEA there is an ongoing supply and demand relationship at work every second in every market at every price level. They are simple math calculations derived from price. Most are averages of price which means they lag price. Any indicator that lags price adds risk and decreases profit margins in your trading which is not ideal. Don't get the wrong idea, this is not another article beating up the indicators. My goal is to expose the flaws associated with using them and also show you a very astute way to use them in all your trading.
Moving Averages and Trend Analysis
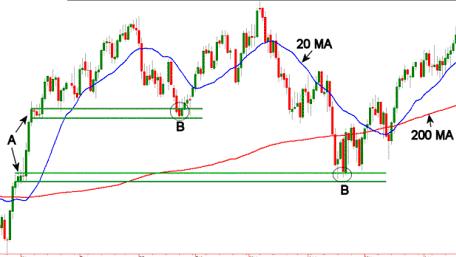
Above we have a chart with a 20- and 200-period moving average. These are widely used moving averages both in the trading and investing community. Notice the slope of the 20-period MA at the area labeled "B". The slope of the 20-period moving average is down in both cases suggesting a downtrend is underway. During this period however, the low risk/high reward buying opportunity is greatest and right in front of you as "B" is the time price is revisiting the objective demand levels "A".
Those who use a MA as a trend filter would never buy when the trend is "down." This group of illusion-based traders and investors would likely conclude and say; "I don't want to buy now, the MA tells me this is a downtrend." The illusion created by only using a MA to determine trend ensures you will ignore the lowest risk/highest reward opportunity to buy (or sell) each time it is offered. Furthermore, this illusion is likely to encourage a trader to take the opposite action of what the objective information (reality) suggests he or she should do.
Moving Averages lag. They are averages of past data. They can only turn higher after price does. Let's focus in on the 200-day moving average. Specifically, notice the area "B" that is below the 200-day MA in. Most traders and investors either see the 200-day MA on a chart or hear about it from some financial news TV program. They perceive the mighty 200-day MA as some magical line that when crossed suggests some valuable information. As we can see, waiting for prices to rise above the 200-day MA before buying ensures three things. First, risk to buy is high, as one would be buying far from the supply/demand imbalance (our demand level from "A"). Second, profit potential is decreased. Third, those who wait until prices have crossed back above the 200-day MA to buy will likely provide profit for the reality based trader/investor who bought at "B," the low risk/high reward entry area. The objective supply/demand imbalance is at "B," and the 200-day MA has nothing to do with it. When a moving average lines up with true demand or supply, the moving average will appear to work. Believing that the moving average actually has anything to do with a turn in price is an illusion.
Let's now explore reality through the eyes of objective logic. The areas labeled "A" are objective demand (support) price levels. How can I claim they are objective demand price levels? It's simple. While prices are trading sideways, supply and demand are in balance. In both instances, prices rose dramatically from those areas of balance. The only thing that can cause a price rally from an area of "balance" is when the supply and demand equation becomes "out of balance." In other words, there were many more willing and able buyers at "A" than there were sellers. The laws of supply and demand simply tell us this is true.
The areas labeled "B" represent the first time prices revisit these two areas of "imbalance." In other words, prices have declined to an area where we objectively know there are more willing buyers than sellers. "B" is the low risk/high reward opportunity to buy. Buying in these two areas ensures three important musts in trading and investing. First, your protective stop must be as small as it can be which offers a trader proper risk management/position sizing. Second, your profit potential, which is the distance from the entry to the supply area above, is as large as it will ever be for this opportunity. In other words, as price moves higher from the objective demand level, it is moving closer to the supply level (target) above, decreasing your profit potential. Third, the probability of success is highest because supply and demand are out of balance.
The Moving Average Cross
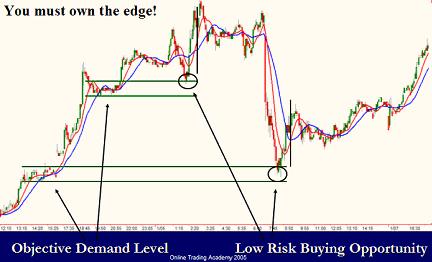
In this example, the circled areas on the chart represent the times when price is declining into our predetermined and objective demand (support) levels which is where we would want to buy. We want to buy here because the risk to buy is lowest and the reward is highest. The black vertical lines on the chart right next to the circled areas show when the moving averages cross, which is a buy signal for most people. Notice how late they cross. Price has moved significantly higher already which means high risk and low reward for the buyer. In both cases, when price is into our demand level and a low risk buy is right in front of us, the MA's have not even begun to turn higher. If you use a moving average cross as a buy trigger, be very careful.
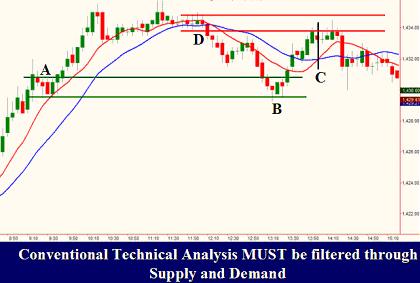
In this example, "B" is the first time price is revisiting demand level "A". "B" is the time we want to buy. "C", however, is when the moving averages finally cross and give the conventional buy signal. If you accept that invitation to buy, you are actually buying right at the supply (resistance) level "D" which will almost always ensure a quick loss. Only a novice trader buys after an advance in price and into an objective supply level. That is what the industry calls "dumb money" and in trading, if you can't see dumb money coming into the market, you are dumb money? Ok, enough negative talk here, let's get some answers and solutions to this issue?
As I mentioned in the first part of this piece, when an indicator or oscillator gives you a buy signal when price is also at an objective demand (support) level, that buy signal is likely to work. The key is to only take those buy signals and ignore the rest. In doing this, we are filtering an indicator through the laws of supply and demand and this is the key in using any indicator or oscillator, including the not so obvious things like Fibonacci and Elliot Wave.
The Answer
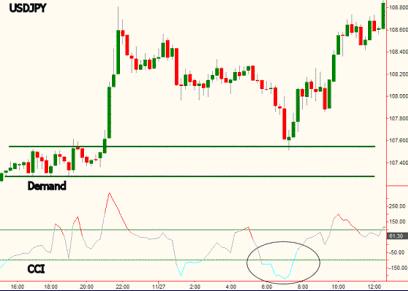
In this chart of the Dollar/Yen, notice CCI on the bottom and the demand level I put on the chart. While CCI gave you many overbought and oversold readings, the oversold signal that occurred as PRICE was also at demand was the buy signal to take. Exactly how to do this is something I focus on plenty in our courses but hopefully this concept will help you out here. Also, while this is a Forex chart, the rules and concepts that I write about are applicable in any and all markets and any and all time frames.
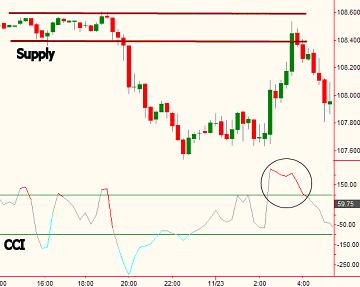
In this example, we again have many overbought and oversold readings from CCI. They are not wrong. CCI is doing exactly what it is supposed to do. Whether these readings turn into profitable buy and sell signals is another conversation, this is what most people learn the hard way. Back to the chart? When price initially drops from the supply level, notice that the CCI goes oversold right away and stays oversold, giving the trader buy signal after buy signal as prices are dropping. Yikes! Again, if you only take the overbought and oversold readings from something like CCI (or any indicator or oscillator) as a buy or sell signal when PRICE is also at a supply or demand level, you are then filtering out most of the losing buy and sell signals and keeping most of the winning signals. Here, when price rallied back up to the predetermined supply level, CCI was also overbought and this was the sell signal to pay attention to.
Understand that the movement in price in any and all free markets is a function of the pure laws and principles of supply and demand. Opportunity exists when this simple and straight forward relationship is out of balance, period. What most people don't understand is that when you ignore a governing dynamic that has been around longer than man has walked the earth, you are almost guaranteed a losing trading strategy. You can spend a lifetime attempting to come up with the perfect set of indicators and oscillators with the perfect set of inputs with hopes of attaining all the worlds' wealth and get nowhere. There is a reason for this which is the one thing you need to know about indicators and oscillators: They have NO IDEA there is an ongoing supply and demand relationship at work every second in every market at every price level. They are simple math calculations derived from price. Most are averages of price which means they lag price. Any indicator that lags price adds risk and decreases profit margins in your trading which is not ideal. Don't get the wrong idea, this is not another article beating up the indicators. My goal is to expose the flaws associated with using them and also show you a very astute way to use them in all your trading.
Moving Averages and Trend Analysis
Above we have a chart with a 20- and 200-period moving average. These are widely used moving averages both in the trading and investing community. Notice the slope of the 20-period MA at the area labeled "B". The slope of the 20-period moving average is down in both cases suggesting a downtrend is underway. During this period however, the low risk/high reward buying opportunity is greatest and right in front of you as "B" is the time price is revisiting the objective demand levels "A".
Those who use a MA as a trend filter would never buy when the trend is "down." This group of illusion-based traders and investors would likely conclude and say; "I don't want to buy now, the MA tells me this is a downtrend." The illusion created by only using a MA to determine trend ensures you will ignore the lowest risk/highest reward opportunity to buy (or sell) each time it is offered. Furthermore, this illusion is likely to encourage a trader to take the opposite action of what the objective information (reality) suggests he or she should do.
Moving Averages lag. They are averages of past data. They can only turn higher after price does. Let's focus in on the 200-day moving average. Specifically, notice the area "B" that is below the 200-day MA in. Most traders and investors either see the 200-day MA on a chart or hear about it from some financial news TV program. They perceive the mighty 200-day MA as some magical line that when crossed suggests some valuable information. As we can see, waiting for prices to rise above the 200-day MA before buying ensures three things. First, risk to buy is high, as one would be buying far from the supply/demand imbalance (our demand level from "A"). Second, profit potential is decreased. Third, those who wait until prices have crossed back above the 200-day MA to buy will likely provide profit for the reality based trader/investor who bought at "B," the low risk/high reward entry area. The objective supply/demand imbalance is at "B," and the 200-day MA has nothing to do with it. When a moving average lines up with true demand or supply, the moving average will appear to work. Believing that the moving average actually has anything to do with a turn in price is an illusion.
Let's now explore reality through the eyes of objective logic. The areas labeled "A" are objective demand (support) price levels. How can I claim they are objective demand price levels? It's simple. While prices are trading sideways, supply and demand are in balance. In both instances, prices rose dramatically from those areas of balance. The only thing that can cause a price rally from an area of "balance" is when the supply and demand equation becomes "out of balance." In other words, there were many more willing and able buyers at "A" than there were sellers. The laws of supply and demand simply tell us this is true.
The areas labeled "B" represent the first time prices revisit these two areas of "imbalance." In other words, prices have declined to an area where we objectively know there are more willing buyers than sellers. "B" is the low risk/high reward opportunity to buy. Buying in these two areas ensures three important musts in trading and investing. First, your protective stop must be as small as it can be which offers a trader proper risk management/position sizing. Second, your profit potential, which is the distance from the entry to the supply area above, is as large as it will ever be for this opportunity. In other words, as price moves higher from the objective demand level, it is moving closer to the supply level (target) above, decreasing your profit potential. Third, the probability of success is highest because supply and demand are out of balance.
The Moving Average Cross
In this example, the circled areas on the chart represent the times when price is declining into our predetermined and objective demand (support) levels which is where we would want to buy. We want to buy here because the risk to buy is lowest and the reward is highest. The black vertical lines on the chart right next to the circled areas show when the moving averages cross, which is a buy signal for most people. Notice how late they cross. Price has moved significantly higher already which means high risk and low reward for the buyer. In both cases, when price is into our demand level and a low risk buy is right in front of us, the MA's have not even begun to turn higher. If you use a moving average cross as a buy trigger, be very careful.
In this example, "B" is the first time price is revisiting demand level "A". "B" is the time we want to buy. "C", however, is when the moving averages finally cross and give the conventional buy signal. If you accept that invitation to buy, you are actually buying right at the supply (resistance) level "D" which will almost always ensure a quick loss. Only a novice trader buys after an advance in price and into an objective supply level. That is what the industry calls "dumb money" and in trading, if you can't see dumb money coming into the market, you are dumb money? Ok, enough negative talk here, let's get some answers and solutions to this issue?
As I mentioned in the first part of this piece, when an indicator or oscillator gives you a buy signal when price is also at an objective demand (support) level, that buy signal is likely to work. The key is to only take those buy signals and ignore the rest. In doing this, we are filtering an indicator through the laws of supply and demand and this is the key in using any indicator or oscillator, including the not so obvious things like Fibonacci and Elliot Wave.
The Answer
In this chart of the Dollar/Yen, notice CCI on the bottom and the demand level I put on the chart. While CCI gave you many overbought and oversold readings, the oversold signal that occurred as PRICE was also at demand was the buy signal to take. Exactly how to do this is something I focus on plenty in our courses but hopefully this concept will help you out here. Also, while this is a Forex chart, the rules and concepts that I write about are applicable in any and all markets and any and all time frames.
In this example, we again have many overbought and oversold readings from CCI. They are not wrong. CCI is doing exactly what it is supposed to do. Whether these readings turn into profitable buy and sell signals is another conversation, this is what most people learn the hard way. Back to the chart? When price initially drops from the supply level, notice that the CCI goes oversold right away and stays oversold, giving the trader buy signal after buy signal as prices are dropping. Yikes! Again, if you only take the overbought and oversold readings from something like CCI (or any indicator or oscillator) as a buy or sell signal when PRICE is also at a supply or demand level, you are then filtering out most of the losing buy and sell signals and keeping most of the winning signals. Here, when price rallied back up to the predetermined supply level, CCI was also overbought and this was the sell signal to pay attention to.
Last edited by a moderator: