Over the past weeks, I have focused my weekly articles on strategies. I have tried to share with you the various strategies I see traders using and finding success with. Today, we will end the strategy series with far and away the most popular entry strategy, the "breakout". The Forex markets are markets that move. In a market that has significant and consistent movement, using breakouts is very appropriate. As with any strategy, there is a right way to understand and use it and a wrong way. In this piece, I will discuss the two most popular breakout entries; Support and Resistance Breakouts and Trend Line Breakouts.
Support and Resistance Breakouts
Once in a while I hear someone say that breakout trading worked best in the late 90's in the stock market. Well, someone who learned to trade in the late 90's and who does not understand breakouts might say that. In those days, you could buy anything at almost any time and make money. Today, breakout trading is where you see most of the money being made in Forex trading by those who truly understand the structure behind a true breakout getting paid from those who don't.
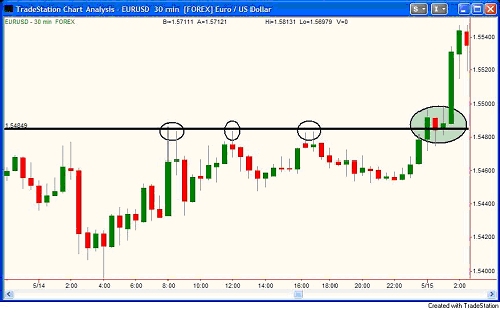
The chart above is the EURUSD. Notice the horizontal resistance line and let's work left to right in our understanding of what's really happening behind these candles in the chart. The first circled pivot high on the left becomes that pivot high because supply in this market greatly exceeds demand at that price level. When price reaches the line, some of the sellers that make up that supply get to sell but there is still much more supply than demand so price has to fall. The drop from that first circled area is significant as we would expect. The next time price revisits that level, it declines again but this time, the decline is shallow compared to the prior visit. This is because each time you revisit the level, more sellers that make up that supply get to sell so the supply and demand equation is becoming more in balance. The analogy here is the chopping down of a tree (not a great example, I know). With each chop, you are removing mass from the tree and therefore, the tree is more and more likely to fall with each chop. In trading, the mass is the supply and demand. Moving left to right, price comes back to that level a third time and falls but again, the decline is shallow suggesting that there are simply not many sellers at that level remaining. Next, price revisits that level a fourth time but this time, instead of declining from that level, it bases sideways suggesting there are no longer more sellers than buyers. This is when you get ready to buy because in Forex trading (and any other market for that matter), price is likely to move higher. One would feel comfortable taking a low risk entry on a breakout here as the objective price action tells us that there are simply few sellers if any left at that price level. This is a trade we take in the Forex Trader Part 1 and 2 classes all the time. This is also a trade you will see taken very often in our Extended Learning Track (XLT) - Forex Trading class . Does every trade work? Of course not, that's trading. This is why it is so important to understand what is driving the movement of these candles. This in turn helps you understand the structure of a breakout. For shorting, we would just do the opposite of what I am suggesting here. If you want to see an example of a shorting opportunity just like this one, print this page out and turn it upside down.
The Trend Line Breakout
Trend line breakouts and breakdowns are a very popular entry in Forex and other markets. Much of the time, this is the only type of entry a student will practice in class all week long because they become comfortable with it as it is simple to understand and can produce some strong moves for a trader.
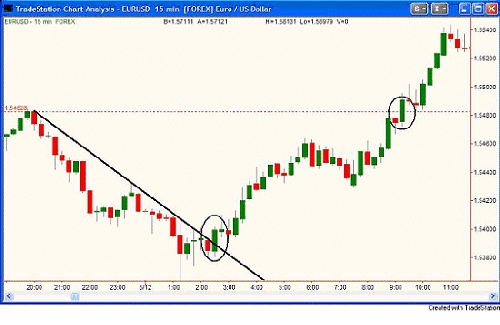
This again is a chart of the EURUSD. The down trend line is drawn once we have two points on a chart which is what is always required when drawing trend lines. Once we have this, we simply draw the line and wait for price to breakout above the line for a long entry. The logic here is that price is trending down because it is at price levels where supply exceeds demand. We want to buy this market when it reaches a price level where demand exceeds supply (more buyers than sellers). Instead of trying to guess at where this might be, the price action on the chart will tell us this if we just wait and watch. When price eventually breaks out above that down trend line, it happens because it has reached a price level where there are more willing buyers (demand) than sellers (supply). This is where we would want to take a low risk entry and buy. While there are many profit taking targets that we cover in class, one logical target for profit is the origin of the decline in price that started the whole downtrend in the first place. This is shown as the dashed red line on the chart above.
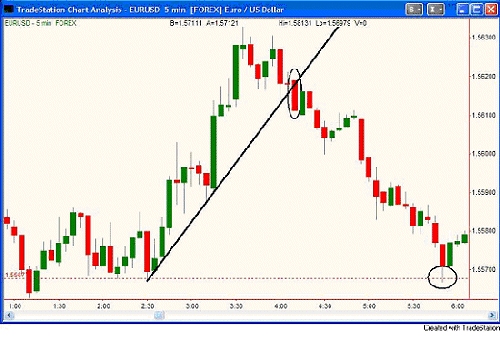
Here we have a steep uptrend as shown by the price action and our uptrend line. Instead of guessing as to where this dramatic advance in price might end or at what price level is all the supply, we can simply draw an uptrend line by connecting the pivot lows and look to sell short on a breakout (breakdown in this case) of that line. As in the last example, a natural target can be the origin of that rally in price as shown by the dashed red horizontal line on the bottom of this chart.
Keep in mind that the most important part of trading is managing risk properly. We focus on this extensively in class. The focus of this piece was to help with entries as that is the beginning of a good risk averse strategy. The breakout entries discussed are equally appropriate in any and all markets so don't think this is just for Forex. Never forget, whether the candles on a screen represent a chart of stocks, futures, Forex, options, football trading cards, rare coins, or anything traded? They are all just people and price. We would quantify a breakout in price the same way in any and all of these markets. If you are watching the buying and selling of a David Beckham rookie card and you see that the last one available at the current price level just sold, what is about to happen to price?
Support and Resistance Breakouts
Once in a while I hear someone say that breakout trading worked best in the late 90's in the stock market. Well, someone who learned to trade in the late 90's and who does not understand breakouts might say that. In those days, you could buy anything at almost any time and make money. Today, breakout trading is where you see most of the money being made in Forex trading by those who truly understand the structure behind a true breakout getting paid from those who don't.
The chart above is the EURUSD. Notice the horizontal resistance line and let's work left to right in our understanding of what's really happening behind these candles in the chart. The first circled pivot high on the left becomes that pivot high because supply in this market greatly exceeds demand at that price level. When price reaches the line, some of the sellers that make up that supply get to sell but there is still much more supply than demand so price has to fall. The drop from that first circled area is significant as we would expect. The next time price revisits that level, it declines again but this time, the decline is shallow compared to the prior visit. This is because each time you revisit the level, more sellers that make up that supply get to sell so the supply and demand equation is becoming more in balance. The analogy here is the chopping down of a tree (not a great example, I know). With each chop, you are removing mass from the tree and therefore, the tree is more and more likely to fall with each chop. In trading, the mass is the supply and demand. Moving left to right, price comes back to that level a third time and falls but again, the decline is shallow suggesting that there are simply not many sellers at that level remaining. Next, price revisits that level a fourth time but this time, instead of declining from that level, it bases sideways suggesting there are no longer more sellers than buyers. This is when you get ready to buy because in Forex trading (and any other market for that matter), price is likely to move higher. One would feel comfortable taking a low risk entry on a breakout here as the objective price action tells us that there are simply few sellers if any left at that price level. This is a trade we take in the Forex Trader Part 1 and 2 classes all the time. This is also a trade you will see taken very often in our Extended Learning Track (XLT) - Forex Trading class . Does every trade work? Of course not, that's trading. This is why it is so important to understand what is driving the movement of these candles. This in turn helps you understand the structure of a breakout. For shorting, we would just do the opposite of what I am suggesting here. If you want to see an example of a shorting opportunity just like this one, print this page out and turn it upside down.
The Trend Line Breakout
Trend line breakouts and breakdowns are a very popular entry in Forex and other markets. Much of the time, this is the only type of entry a student will practice in class all week long because they become comfortable with it as it is simple to understand and can produce some strong moves for a trader.
This again is a chart of the EURUSD. The down trend line is drawn once we have two points on a chart which is what is always required when drawing trend lines. Once we have this, we simply draw the line and wait for price to breakout above the line for a long entry. The logic here is that price is trending down because it is at price levels where supply exceeds demand. We want to buy this market when it reaches a price level where demand exceeds supply (more buyers than sellers). Instead of trying to guess at where this might be, the price action on the chart will tell us this if we just wait and watch. When price eventually breaks out above that down trend line, it happens because it has reached a price level where there are more willing buyers (demand) than sellers (supply). This is where we would want to take a low risk entry and buy. While there are many profit taking targets that we cover in class, one logical target for profit is the origin of the decline in price that started the whole downtrend in the first place. This is shown as the dashed red line on the chart above.
Here we have a steep uptrend as shown by the price action and our uptrend line. Instead of guessing as to where this dramatic advance in price might end or at what price level is all the supply, we can simply draw an uptrend line by connecting the pivot lows and look to sell short on a breakout (breakdown in this case) of that line. As in the last example, a natural target can be the origin of that rally in price as shown by the dashed red horizontal line on the bottom of this chart.
Keep in mind that the most important part of trading is managing risk properly. We focus on this extensively in class. The focus of this piece was to help with entries as that is the beginning of a good risk averse strategy. The breakout entries discussed are equally appropriate in any and all markets so don't think this is just for Forex. Never forget, whether the candles on a screen represent a chart of stocks, futures, Forex, options, football trading cards, rare coins, or anything traded? They are all just people and price. We would quantify a breakout in price the same way in any and all of these markets. If you are watching the buying and selling of a David Beckham rookie card and you see that the last one available at the current price level just sold, what is about to happen to price?
Last edited by a moderator: