Whether I am trading or instructing a stock, futures, or options class, our lowest risk and highest reward trade each day is typically the opening gap entry. As soon as I suggest the trade to the class, someone always says: "I was told we are not supposed to trade the open because it is not for the novice trader". That is not exactly what we say. What we say is that the open is not for the novice trader. It is, however, a fantastic opportunity for the astute trader who knows how to identify a novice trader. Most of the time, our entry is within seconds to minutes of the opening bell. There is a reason for this?
Why do prices gap up? They gap up because there are more buy orders at the open than there is available supply at the prior day's closing price. They gap down because there are more sell orders at the open than willing demand at the prior day's close. Therefore, market prices are almost always at price levels where there is a supply and demand imbalance (opportunity) at the open. Never forget, the successful market speculator simply finds markets where price is at levels where supply and demand are out of balance and trades them back to price levels where supply and demand is in balance. I started in this business on the floor of the Chicago Mercantile Exchange, handling institution and retail order flow. Watching that order flow made it easy to see where prices were going to turn. For example, if we had 10 buyers and 5 sellers at a price level, as soon as the 5th seller sold, price had to rise. Having the orders in your hand makes this easy to see. Knowing exactly what this picture looks like on a price chart makes it even easier.
This week in the markets represented obvious opportunities related to gaps and order flow. We took advantage of them in class here in Chicago each day. We will do the same thing in Boston next week as two things never change. First, order flow works the same way it did 100 years ago and never changes. Second, novice traders are always present and are only growing in numbers. Here is how it all works?
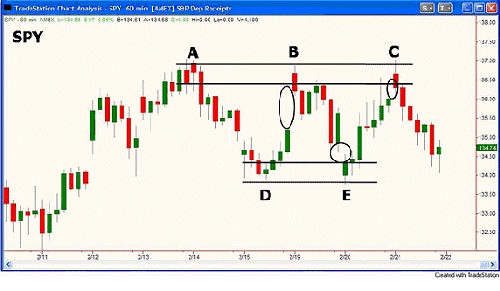
Below we have a chart of the S&P as seen through the SPY, the ETF for the S&P. "A" represents a resistance (supply) level. We know this because price could not stay at that level, it had to fall because there are more willing sellers than buyers at that level. "B" is a day this week where price gapped right into that resistance (supply) level at the open. Here, the novice trader buys and the astute trader sells to that buyer. Remember, a supply level is a price level where there are more sellers than buyers. The last thing you want to do is buy at that price level and that is exactly what the novice trader did that morning on the open. In class here, we sold to that buyer and profited on the decline in price. We know this is a novice buyer because only a consistent losing trader would buy a gap up, after a rally in price, and into an objective supply level. The very next day at the open "E", price gapped down into an objective demand level "D". Only a novice trader would sell a gap down, after a decline in price, and into an objective demand (support) level, "D". We simply bought from that novice seller and profited nicely on the trades. The very next day at the open "C", price gapped up right into an objective supply level, "A" and "B". That short entry at "C" was very low risk and high reward but you had to be trading at or near the open to get that low risk short entry which was true for all the gap entries for the week.

The key is to not look at candles on your screen as red and green pictures and patterns. You must understand what is happening behind the scenes. Whether you're trading stocks, futures, options, or forex, the logic and rules never change.
Again, the market imbalances are greatest at or near the open of trading in all markets. By the end of the first hour of trading each day, a large amount of novice trading capital is simply transferred into the accounts of the astute trader. If you can't see the novice trader in markets, you likely are the novice trader.
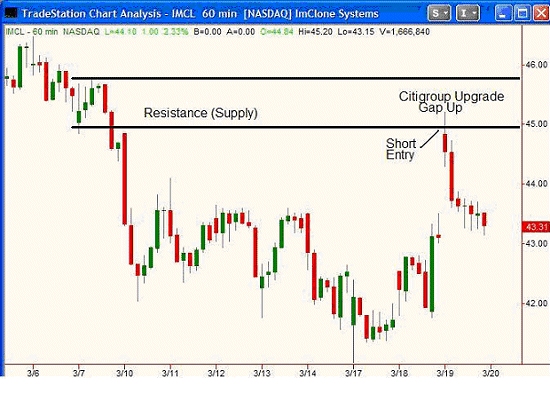
A few weeks ago I happened to be in LA instructing a stock class and on the 19th March, a morning opening gap in the US stock markets offered us a very low risk and high reward opportunity. Our morning prep work basically consists of finding stocks that are opening at price levels where supply and demand are out of balance in a large way and then simply trading them back to balance. Once the traders understand the whole supply (resistance)/demand (support) concept and the rules, we use two sources to find these opportunities which typically present themselves right at the open of trading or shortly thereafter. One of our sources offers us the morning broker upgrades and downgrades. An upgrade that jumped out at us was Citigroup who was upgrading shares of Imclone (IMCL) with a "Buy" recommendation. While we are trading real money in class, you might think we would want to listen to this upgrade and do exactly what it is suggesting to do as Citigroup is one of the largest banks in the world and we are just 20 people in a trading class in LA. Well, it really depends on your point of view. Citigroup likely had good fundamental reasons to upgrade the stock and looking at the chart below, MANY people listened with both ears and bought IMCL on the open which is what caused that gap up in price. If your point of view is that of a smart buyer and seller of anything who has an understanding of the laws of supply and demand, not only were you not buying like everyone else was, you were selling to that huge group of buyers (at least we were).

Notice the price action on 3/7. There was a dramatic price decline from the $45-$46 price level. This can only happen because there is much more supply at that level than willing demand. When this happens, price must decline. The dramatic rate of decline suggests a strong supply and demand imbalance at that level. Now, notice what happens the morning of the upgrade on 3/19. Citigroup upgrades the stock and price opens right into that supply level. While the rest of the world is buying in a strong way, we had our plan in place well before the open that told us to sell to anyone who wanted to buy at that level. Why? Because we knew that if we sold to the buyers at that price level on the gap up, we would be selling to novice buyers who likely are consistent losing market speculators. How do we know this? Only a novice would buy AFTER an advance in price and INTO a price level where supply exceeds demand. Our job is to find this novice trader and simply take the other side of his or her trade.
When you enter markets at price levels where supply and demand are out of balance in a big way, especially at or near the open of trading, moves in the market are typically very fast. There were many other stocks this day that did the exact same thing and those who did the 15 minutes of morning prep work that we do each day were rewarded with low risk/high reward gains.
This trade and the thoughts and rules that went with it are not meant to impress you. I mean to impress upon you the importance of looking at markets for what they really are which is simply an ongoing supply and demand equation. Opportunity exists when this simple and straightforward relationship is out of balance. Everything else in and around markets is just "noise" that is meant to invite you into markets at the wrong time and in the wrong direction. As an educator, I say that is unfortunate. As a trader, I love it - the more noise the better!
Why do prices gap up? They gap up because there are more buy orders at the open than there is available supply at the prior day's closing price. They gap down because there are more sell orders at the open than willing demand at the prior day's close. Therefore, market prices are almost always at price levels where there is a supply and demand imbalance (opportunity) at the open. Never forget, the successful market speculator simply finds markets where price is at levels where supply and demand are out of balance and trades them back to price levels where supply and demand is in balance. I started in this business on the floor of the Chicago Mercantile Exchange, handling institution and retail order flow. Watching that order flow made it easy to see where prices were going to turn. For example, if we had 10 buyers and 5 sellers at a price level, as soon as the 5th seller sold, price had to rise. Having the orders in your hand makes this easy to see. Knowing exactly what this picture looks like on a price chart makes it even easier.
This week in the markets represented obvious opportunities related to gaps and order flow. We took advantage of them in class here in Chicago each day. We will do the same thing in Boston next week as two things never change. First, order flow works the same way it did 100 years ago and never changes. Second, novice traders are always present and are only growing in numbers. Here is how it all works?
Below we have a chart of the S&P as seen through the SPY, the ETF for the S&P. "A" represents a resistance (supply) level. We know this because price could not stay at that level, it had to fall because there are more willing sellers than buyers at that level. "B" is a day this week where price gapped right into that resistance (supply) level at the open. Here, the novice trader buys and the astute trader sells to that buyer. Remember, a supply level is a price level where there are more sellers than buyers. The last thing you want to do is buy at that price level and that is exactly what the novice trader did that morning on the open. In class here, we sold to that buyer and profited on the decline in price. We know this is a novice buyer because only a consistent losing trader would buy a gap up, after a rally in price, and into an objective supply level. The very next day at the open "E", price gapped down into an objective demand level "D". Only a novice trader would sell a gap down, after a decline in price, and into an objective demand (support) level, "D". We simply bought from that novice seller and profited nicely on the trades. The very next day at the open "C", price gapped up right into an objective supply level, "A" and "B". That short entry at "C" was very low risk and high reward but you had to be trading at or near the open to get that low risk short entry which was true for all the gap entries for the week.

The key is to not look at candles on your screen as red and green pictures and patterns. You must understand what is happening behind the scenes. Whether you're trading stocks, futures, options, or forex, the logic and rules never change.
Again, the market imbalances are greatest at or near the open of trading in all markets. By the end of the first hour of trading each day, a large amount of novice trading capital is simply transferred into the accounts of the astute trader. If you can't see the novice trader in markets, you likely are the novice trader.
A few weeks ago I happened to be in LA instructing a stock class and on the 19th March, a morning opening gap in the US stock markets offered us a very low risk and high reward opportunity. Our morning prep work basically consists of finding stocks that are opening at price levels where supply and demand are out of balance in a large way and then simply trading them back to balance. Once the traders understand the whole supply (resistance)/demand (support) concept and the rules, we use two sources to find these opportunities which typically present themselves right at the open of trading or shortly thereafter. One of our sources offers us the morning broker upgrades and downgrades. An upgrade that jumped out at us was Citigroup who was upgrading shares of Imclone (IMCL) with a "Buy" recommendation. While we are trading real money in class, you might think we would want to listen to this upgrade and do exactly what it is suggesting to do as Citigroup is one of the largest banks in the world and we are just 20 people in a trading class in LA. Well, it really depends on your point of view. Citigroup likely had good fundamental reasons to upgrade the stock and looking at the chart below, MANY people listened with both ears and bought IMCL on the open which is what caused that gap up in price. If your point of view is that of a smart buyer and seller of anything who has an understanding of the laws of supply and demand, not only were you not buying like everyone else was, you were selling to that huge group of buyers (at least we were).

Notice the price action on 3/7. There was a dramatic price decline from the $45-$46 price level. This can only happen because there is much more supply at that level than willing demand. When this happens, price must decline. The dramatic rate of decline suggests a strong supply and demand imbalance at that level. Now, notice what happens the morning of the upgrade on 3/19. Citigroup upgrades the stock and price opens right into that supply level. While the rest of the world is buying in a strong way, we had our plan in place well before the open that told us to sell to anyone who wanted to buy at that level. Why? Because we knew that if we sold to the buyers at that price level on the gap up, we would be selling to novice buyers who likely are consistent losing market speculators. How do we know this? Only a novice would buy AFTER an advance in price and INTO a price level where supply exceeds demand. Our job is to find this novice trader and simply take the other side of his or her trade.
When you enter markets at price levels where supply and demand are out of balance in a big way, especially at or near the open of trading, moves in the market are typically very fast. There were many other stocks this day that did the exact same thing and those who did the 15 minutes of morning prep work that we do each day were rewarded with low risk/high reward gains.
This trade and the thoughts and rules that went with it are not meant to impress you. I mean to impress upon you the importance of looking at markets for what they really are which is simply an ongoing supply and demand equation. Opportunity exists when this simple and straightforward relationship is out of balance. Everything else in and around markets is just "noise" that is meant to invite you into markets at the wrong time and in the wrong direction. As an educator, I say that is unfortunate. As a trader, I love it - the more noise the better!
Last edited by a moderator:


