The most important thing in any type of trading is to have a solid set of rules and then to have the self control to follow those rules. Day traders especially need to have rules to follow as emotion can and will have you buying and selling at the wrong time.
Day Trading Rules:
Remember, any and all influences on price are reflected in price? Price is all we need.

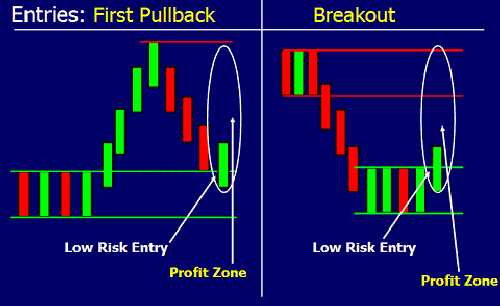
Here are the only two types of entries you will ever need. The First Pullback entry is the lower risk/higher reward entry though many people are not comfortable with it. Most will use Breakout entries which are fine when executed properly. What determines whether each entry will work or not are two things. We will use demand as an example in this case as both examples here are moves from demand. First, the demand area must be a fresh demand level meaning that price has not revisited the level. Second, the Profit Zone (profit margin) must be significant as seen in the chart above. In other words, there must be room for price to move after you enter. We will revisit the topic of "entries" next week.
Trading Ideas
Russell 2000 (Futures)

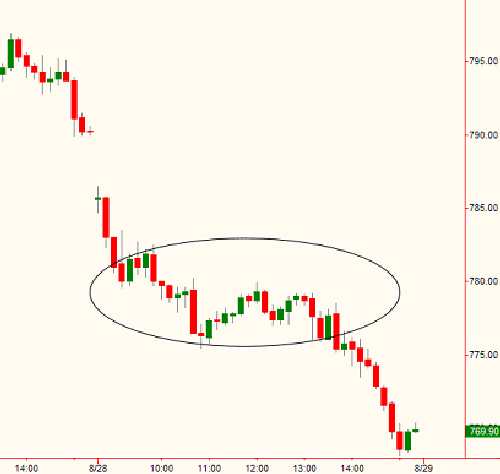
This a chart of the Russell Futures. After yesterday's decline, we will look to sell short after a rally in price to the nearest supply (resistance) level above. The first supply level will be found in the area shown above here on the chart. The reason we select this circled area is because there was a cluster of trading which gave the appearance of supply/demand equilibrium. When price then declined from the level, this decline tells us that supply actually exceeded demand. This can be the only reason for the decline in price from the level. Therefore, we will look to short the first rally back to this level which can happen as soon as today.
Euro/Pound (Cash Forex)

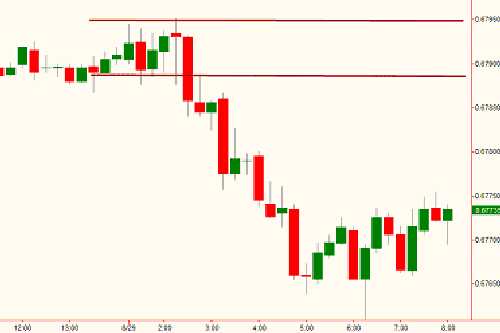
After a dramatic decline in this market, price has stabilized and found support (demand). The dramatic decline tells us that there is likely a large supply/demand "imbalance" at that level above, suggesting a high probability opportunity. This market is a very active market and is a non-dollar currency pair which is ideal.
10 Year Note (Futures)

This is a chart of the 10 Year Note Futures. The green lines are around the demand (support) level. This is the nearest demand level below current price and is a price level we would look to buy at the FIRST time price revisits this level. The strong initial rally out of the level and gap suggests a strong supply/demand imbalance at the level.
Day Trading Rules:
- Only enter trades when price is at a support (demand) or resistance (supply) level, no matter what time of day or night.
- Two types of entries: Breakouts and first pullbacks (see below).
- Each day, identify one demand and supply level in each market, using a larger intra-day time frame. Always know where the market is in the larger picture with regard to supply and demand.
- Only trade opportunities that offer at least a 3:1 profit zone to the first target.
- Pre-plan and pre-set: Entry, Stop, Target/s.
- Don't get fooled by: News, Lagging indicators, Subjective information.
Remember, any and all influences on price are reflected in price? Price is all we need.

Here are the only two types of entries you will ever need. The First Pullback entry is the lower risk/higher reward entry though many people are not comfortable with it. Most will use Breakout entries which are fine when executed properly. What determines whether each entry will work or not are two things. We will use demand as an example in this case as both examples here are moves from demand. First, the demand area must be a fresh demand level meaning that price has not revisited the level. Second, the Profit Zone (profit margin) must be significant as seen in the chart above. In other words, there must be room for price to move after you enter. We will revisit the topic of "entries" next week.
Trading Ideas
Russell 2000 (Futures)

This a chart of the Russell Futures. After yesterday's decline, we will look to sell short after a rally in price to the nearest supply (resistance) level above. The first supply level will be found in the area shown above here on the chart. The reason we select this circled area is because there was a cluster of trading which gave the appearance of supply/demand equilibrium. When price then declined from the level, this decline tells us that supply actually exceeded demand. This can be the only reason for the decline in price from the level. Therefore, we will look to short the first rally back to this level which can happen as soon as today.
Euro/Pound (Cash Forex)

After a dramatic decline in this market, price has stabilized and found support (demand). The dramatic decline tells us that there is likely a large supply/demand "imbalance" at that level above, suggesting a high probability opportunity. This market is a very active market and is a non-dollar currency pair which is ideal.
10 Year Note (Futures)

This is a chart of the 10 Year Note Futures. The green lines are around the demand (support) level. This is the nearest demand level below current price and is a price level we would look to buy at the FIRST time price revisits this level. The strong initial rally out of the level and gap suggests a strong supply/demand imbalance at the level.
Last edited by a moderator:
