The DOW This Week...28/01- 01/02/02

ChartMan

Legendary member
Messages
5,580
Likes
47
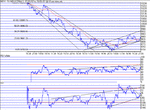
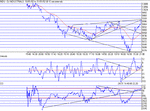
Pretty much went to plan from Friday's suggestion- H&S to 9820/retrace to 9810. The failing point is that the original uptrend support line failed. This is now replaced by a new shallower slope line.The uptrend resistance line is now reconsidered and re-drawn to be parallel with the support line.
From the open the DOW rose to test resistance straight away, and promptly failed to fall to the H&S target of 9820, and then to 9810 and then a bounce on 9800.Then followed a rally, briefly testing the point on the way up to close at a respectable 9865.
Two things to note today. There was a strong finish and there was a significant change in the trend slope from the bottom at 9800, indicating the chance for a good day's rally tomorrow.Part of the slope increase also briefly tested 9850 support point and bounced right off upwards. My one concern is that TA hasn't matched the slope increase...However, I'll carry on with my head on the block and say we're in for a good day :) Reason? I see a nice Bull wedge fomation in TA and a significant TA support trend line break to the upside, which is not showing in the price.....Just for good measure, I've drawn in another possibility for an uptrend support line- much shallower than the previous ones....
Today's 25 point rise leaves us a lot of work to do to get to 10K . The average daily rise has dropped to 40 points, putting 10K further out to Thursday/Friday...

100MA 9829. Support 9850,9820,9800: Resistance 9875, 9900, 9980.
 

Attachments

  • dow280102.gif
    dow280102.gif
    16.4 KB · Views: 533
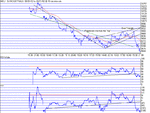
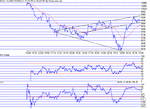
So now my head is in the basket good and proper. :( I missed the all important possibility of a Bear ascending triangle.Shame on me. I'm still surprised at the size of the drop and have to consider now the implications...I guess the bottom line is that we have just had the second leg of a major down wave, leading on to 9300 or so. There's support at 9600....and then a big hole to 9300. Such a big drop will be hard to maintain and the 1 min chart shows pos. divergence into the close, thoroughly weak though it was. The grim reaper has passed this way...

100MA 9765. Support 9600, 9500,9300: Resistance 9672,9700,9750,9800.
 

Attachments

  • dow290102.gif
    dow290102.gif
    15.5 KB · Views: 478
Don't be too hard on yourself Martin - it wasn't a classic bearish rising triangle, and it could have been interpreted the way you originally presented it. And i think we both agreed that the medium term outlook was bearish - it just came rather more suddenly than expected.

I get the following every morning (US - EST time) which i wish i had read earlier.

************

Chart of the Day: Nasdaq 100 Volatility Index (VXN)
by David Nichols, Editor

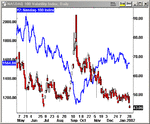
Yesterday we showed a chart of the VXN and discussed it briefly, but it's worth revisiting this topic again today in more detail, as a remarkable market phenomenon is unfolding. This is a complicated chart, but it's worth putting in a little time to understand the situation.


The candles are the movements of the VXN, which is the volatility index on the Nasdaq 100. This measures, in fine detail, the price of options on the Nasdaq 100 (exactly like the VIX, which measures the price of options on the S&P 100). When it's high, traders will pay up for puts because they're fearful of declines; when it's low, traders are not worried about paying high premiums for puts, because everything is seemingly rosy.

The Blue Line on the chart is simply the price movement of the Nasdaq 100, overlayed for comparison.

In general, the VIX and VXN should move contrary to price. When prices go down, people get scared, so they're willing to pay more for puts. Look at the spike back in September -- that represents a lot of fear. When prices go up, people get enthusiastic and buying puts isn't even on the radar, so put premiums -- and the VIX and VXN -- go down.

But what happens when the opposite occurs? What happens when the VXN goes down sharply when prices aren't really going up?

That's what we are seeing right now, in a very dramatic way. This is the "sentiment divergence" that we've talked about before -- when sentiment is not moving in sync with prices. These are extremely powerful setups for a market reversal.

The VXN hit a new low yesterday of 43.06. Usually, this kind of move would accompany a big spike up in the NDX -- yet the index barely moved up yesterday! The VXN has been plunging while the NDX is unable to even approach recent highs.

This is classic sentiment behavior seen at the end of advance phases in the market. Phil Erlanger has taught us well on this. When it takes very little to whip the crowd into a frenzy of enthusiasm -- even a decline, because heck, it's a buying opportunity! -- then you know that sentiment has reached an extreme of bullishness.

The market is getting ready to move against the bullish majority in a big way. When this happens is anybody's guess, but the conditions are ripe. It will be very, very hard for the market to make upside headway right now; it will either continue to go sideways (with possible short bursts up to continue to fool people), or it will decline and build up some much needed pessimism.

By the way, it was this exact same sentiment divergence seen all last summer that had us bearish, and kept us on the short side for big gains heading into September. It's also important to note that this kind of market action is specifically designed to fool the most people into bullishness; you can expect to hear a lot of divergent opinions about the market right now. However, it's been our personal experience that you ignore these extremes of sentiment at your own risk.

Whenever you hear analysts say: "Oh, the VIX doesn't matter anymore", that's when you know it matters the most!
 

Attachments

  • vix290102.gif
    vix290102.gif
    14.8 KB · Views: 514
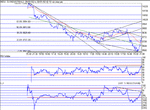
Just a quick blast tonight....The reaction rally was only to be expected after such a dramatic decline...today's surprise was the continued decline to 9530, then a strong rally to close at 9763, 7 points off HOD. TA downtrend lines are almost broken to the upside, the 100MA has been recovered and all looks rosy.... Very bizarre. We now get the possibility of an expanding triangle- leading to greater volatility.No point in saying where it's going, just watch the S&R points...however a pullback to 9700 and rally to 9900 would be nice and take us right back to the uptrend support line of two days ago. IF the DOW can get there, then that will be a descisive point. OR we could bounce down off 9780 and enter into a 250 point down channel....
100MA : 9697. Support: 9550,9636,9700,9732. Resistance: 9760,9800,9840,9890.
 

Attachments

  • dow300102.gif
    dow300102.gif
    15.5 KB · Views: 457
I wish I had as much experience in TA as I have in computers- 30 yrs plus....In the last couple of days, you could have either more than doubled your money, or lost everything on the DOW. The peak- trough- peak could have netted you 700 points so far. Yesterday it looked like it could claw back all it's losses or fall into oblivion.Today brings us to a crossroads, as suggsted yesterday. Tomorrow we go one of two ways for the next few days. Break and hold the 9020 point and we go on up. Bounce down and we can look forward to 9400. TA looks good in all timescales, except the 5 min looks a tad flakey, but still not breaking the uptrend support. I said in the chat room, just before leaving for tea, that there was a nice bull wedge forming, with a target of 9000, and we just got there. :) The final breakout came at around 8:15. So, shall I put my head on the block again? .....perhaps not- the last one left a mess on the carpet .....
What we can say is that the 250 point down channel option suggested yesterday is not an option ( for now). The expanding triangle is shaping up nicely, having 4 tops and 3 bottoms. The good books on TA suggest that expanding triangles ( unusual) go in the direction of the Bear, so whilst tomorrow may look to the upside, beware. There are also job figures out tomorrow that may have an effect... So, long above 9900 and short below, after the first half hour....Wouldn't it just be so nice if the DOW made 10K, like I'd hoped on Monday.

100MA : 9812 Support: 9900,9860,9800,9700. Resistance: 9930, 10K.
 

Attachments

  • dow310102.gif
    dow310102.gif
    15.6 KB · Views: 419
Well, we didn't make 10K, but then again we didn't make 9500 either. Early watchers could have been forgiven for thinking 10K was on, but Neg. Divergence on the 1 min chart precluded any real possibility of that. (Look at today's 1 min DOW in the TA section). The decline came following a double top and bounce off uptrend resistance at 9940( and horizontal resistance), falling to support at 9960, before rising again to close at 9007 12 points down on the day.Given the fact that it's a weekend, one would have expected a sell off into the close, but it didn't happen. Relatively speeking, trading into the close was strong.This gives hope to a continuation of trading in the uptrend channel, until there is a break. 9932/40 is seen as strong resistance as it is the intersection of both the rising trend line and the horizontal resistance line. If the bear theory of expanding triangles was going to happen, it's either been knocked on the head, or at least, delayed. One for the reference folder if it turns Bullish. On the other hand, one could argue that it isn't a true expanding triange on the basis that it is heavily biased on the topside, and the bottom peak was a "freak". My feeling is that as the uptrend support held convincingly at 9860, it's not heading for 9500 ...yet.
I have been looking at expanding triangles on the DOW over the last few years and have uncovered some interesting things. I'll post on the TA section about that as well.
100MA: 9844 Support: 9860,9832,9800. Resistance: 9930, 10K
 

Attachments

  • dow010202.gif
    dow010202.gif
    13.7 KB · Views: 372
Top