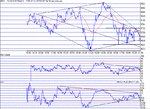
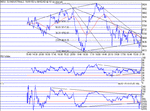
The DOW This Week...04/02....08/02

ChartMan

Legendary member
Messages
5,580
Likes
47
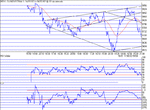
Well, I knew it had to be too good to be true. Just as I thought the bounce wasn't going to happen, it comes with avengence.Right from the open it was a stepping stone drop through the support stops all the way to 9700 and then more...closing at 9687. It seems like this expanding triangle is not done by a long way. If it goes to the edge we'll be at 9400 or so. Given that today's support values didn't 'support', it is a little pointless trying to second guess at a level that will. Hold on to your hats and enjoy the ride I guess. All I'll hazard to say is that the next important point for a reversal would be around 9600, which would provide the start of a 300 wide up channel.
100MA: 9797. Support 9600,9400. Resistance: 0700,9732,9764,9800.
 

Attachments

  • dow040202.gif
    dow040202.gif
    15.2 KB · Views: 487
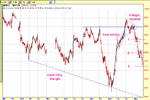
Thanks Martin. Here's my interpretation of the Dow chart. The bear wedge in the run up to the top of the expanding triangle made it a near certainty that the resistance at the top of the triangle would hold. Therefore although the triangle at the top would normally be a continuation pattern, this time it was a reversal. Look how the consolidations at 1 and 2 (75pts between top -1 - 2 - close are spread equally. This could either mean that we have reached the bottom of a 3 wave decline, but more likely imho that as it was still falling into the close that there is more downside tomorrow - either to support at around 9550, or if to the bottom of the expanding triangle to around 9400 as Martin suggests, and if that doesn't hold - gawd help anyone who's long because it implies 8900.

Sleep well.
 

Attachments

  • dow040202.gif
    dow040202.gif
    32.7 KB · Views: 496
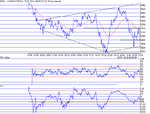
Roger, it's really great to get another view. It's kinda lonely here, and I get a bit blinkered sometimes, missing things that perhaps I should not have done. I think it's called a 'one track mind'. I'm sure putting two or three heads together would end up as 'more than the sum of the parts'. So, on to today's DOW. The open got off to a quick start, bouncing off resistance at 9700 and promptly tanking 100 points to the support that I suggested yesterday. Then a flyer to 9757 for 150 points, near to the next resistance of 9764. And so we went on up and down wandering around looking for some sort of direction, bouncing off support and resistance, to finally close down a couple of points. So what for tomorrow? Still no direction that I can see. The hypothetical uptrend support, parallel to the uptrend resistance line gave support at 9600 today,and two bounces between 9664 and 9764 gives some guidance.I'd like to see another bounce down to 9613 to strengthen the uptrend support line, but we'll have to wait and see. I'm puzzled by the number of times '32' and '68' appear as support/res. values...If 9568 support goes, then as Roger says, 'abandon ship', or enjoy the ride, depending on which side of the fence you are on.
100MA: 9743. Support: 9664,9613,9568. Resistance: 9732,9764,9800,9828,9890.
 

Attachments

  • dow050202.gif
    dow050202.gif
    15.3 KB · Views: 454
Well I count 5 waves down for yesterdays decline into this morning.
Then a classic 3 wave ABC correction.
Followed by the start of wave 3.
The Dow topped out at 9773 - 50% retracement of the decline from 9940.

If wave 3 is equal to wave 1 we should hit 9470-9430 with 9450 being the 38% fib retrace of the rally from Sep.
Wave 1 of 3 is complete with wave 2 complete or near complete. Suggesting a drop at or near the open.

I am hoping for a 200pt decline tomorrow.

Wave 5 will be needed to hit the lower line of the expanding triangle?

Regards,
Ian
 
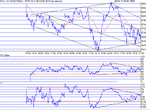
Not a lot happened today...Except a few more possibilities have emerged...A diamond formation is one, two possible down channels, one 125 pts wide and an "inner one" 75 points wide and finally a triangle formation.These triangles will tend to break in the direction of the prevailing trend which is down. We got the uptrend support this afternoon,bouncing off my suggested value of 9613 (9610).There was also a nice triangle breakout fron resistance of 9668, having tested it four times, to finally break on the 5th attempt. The break was perfection itself...from a low of 9610 to resistance at 9668 (58 pts) led to a run up exactly to target- 9726. Pukka! The break came at RSI 66 and CCI 111.During this formation, there was a lot of whipsawing around the 100 MA (9650 ish), an inverse Head & Shoulders and a normal Head & Shoulders.The break was always in trouble as Negative divergence set in from the first peak of the 3 peak rise, immediately dropping from 9726.From there is was a straight run down to close at 9653, to close 32 down on the day.
The triangle break points for tomorrow are 9625 and 9717. On balance, I think the triangle will break to the upside. There is a parallel up channel being formed by velocity and TCI, all other TA indicators being roughly in line with the price action. Yes I know this is contrarian, but there we are. It's better to be aware of the possibilities, Support, Resistance etc, rather than stabbing in the dark. As the dow approaches Support, you have to know that it may well fall through, big time. Being long near support is not a wise move as falls are frequently far more violent than breaks to the upside.Far better to wait for a clear sign of a bounce off support. It's also not a good idea to second guess a move at or near the 100MA, as we discussed and saw in the chat room this afternoon. My advice to wait for the break at 9668 whilst the action was around the 100MA was for good reason.Patience would have been rewarded.
100MA : 9706. Support: 9625,9610,9568. Resistance: 9668,9700,9732,9764,9800.
 

Attachments

  • dow060202.gif
    dow060202.gif
    16.3 KB · Views: 395
Martin

There is another possible channel :-
Across the highs from 9907, 9773, 9700 and 9690.
Across the lows at 9730, 9660 and 9608.

I was watching this potential channel today but then didn't trade it when the spike up 9730 exceeded it, it then bounced down from it twice.

What do you reckon?

Regards,
Ian
 
I have checked back on the last diamond on the dow, and generally , it is a continuation pattern, ie, it was a consolidation in the middle of an uptrend( see archive dated 26/10/01).The exit was a bit wobbly, in that there was a false break down follwed by a final break to the upside.So can we conclude that this diamond will break to the down side as a continuation? Insufficient data at this stage as one occurance is no guide...unless someone knows different.
Today's action was broadly up and down between resistance and support and no real attempts at any breakouts, although the close dropped through the uptrend support line by 20 points. to close at 9624, down 28 on the day. So broadly a consolidation and no further clues as to direction. As we closed to the downside, the next important point to watch will be the loss of support at 9600. The triangles formed in TA have now broken to the downside in all timescales, so little chance of upside tomorrow...Stochastics though are at a low, and there was 4 increasing rates of decline during the drop from 9740, supporting a "too much too quick" theory that would mean upside tomorrow.Too tricky to guess. :)
100 MA : 9697. Support : 9610, 9568. Resistance : 0960/68,9700,9732.
 

Attachments

  • dow070202.gif
    dow070202.gif
    17 KB · Views: 351
Well I hedged both ways and got both right- or wrong depending on your viewpoint. Watch 9600, and no upside, but stochs. low and over cooked.We got both! From the open we were off to test 9700 and fail, then down to test 9620 twice, and fail big time dropping through the 9600 support to bounce on 9561 (9568). Then a big rise to resistance at 9650 ( missed that one..), a quick pullback to support at 9600 and then a flyer to the end, to close at HOD of 9745. And so it was that we blew 9600 and broke the triangle to the upside. I'll resevre judgement on the diamond formation for a few days to see how it pans out. If it turns out to be a valid break to the upside then it will be 2:0 in favour of an outright bull move. So what next? Well, the same applies today as yesterday, too much too soon... but no visible slope rate changes,indicating continued strength.That's not to say there won't be a pullback on Monday's open, perhaps down to 9700, or even 9660, the new downtrend support. The strength is there to go all the way back to the recent top at 9933 and beyond...The last rapid rise made 400 points from the bottom, and the same rule will take us to 10k. Also interesting to note is the start time of these two major rallies....18:30 give or take a bit. Check the Fib. retacement too- it's spot on 50%, althought the other values have no real relationship to the action over the past few days.See also the daily chart in the TA section.
100 MA: 9675. Support: 9732, 9700,9664,9650, 9616. Resistance: 9800,9828,9900,9932.
 

Attachments

  • dow080202.gif
    dow080202.gif
    18.2 KB · Views: 327
Top