The Dow - May 23-27 2005

CZON said:
Vacillating for the last few hours between 10480 and 10500, hmmm any hints guys?. BTW I agree with your comments about SB firms, I have to part with some moeny to learn from experience. Can you recommend some real DOW index proper trading firms, or its futures?

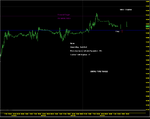
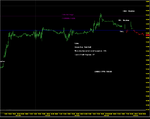
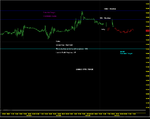
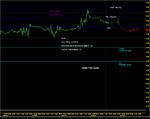
Watching 1 and 3 minute charts for the past hour or so I get the distinct impression of a lot of shorts committing or re-committing after getting burned on the way up. Every time it moves towards 10480 it is rebuffed on increasing volume so there are still plenty of buyers at that level.

On the premise that the market has a long history of cheating the bears (ie nobody should make money on the way down), my guess is that we will see a bit more upside before the coming major correction - just to give shorts a bit more pain. But frankly I don't know and I don't really care. I missed out small-time on the gap this morning but I've bagged 18 points (net 14) on those zigzags between the range mid-line and S1 so I'm quite happy to sit back to see if there's a clear resolution before the close. Could be a sell-off I suppose - been a while since we had a spectacular one of those into the close.

Choice of trading vehicle?? - depends on lots of things. I am strictly intra-day these days and could not possibly trade my system profitably through SB's or CFD's. I use Bracket Trader as a front-end to IB with ESignal + a load of add-on gubbins for charting/analysis. Mainly trade the DOW but a bit on the DAX too.
 
bingo
 

Attachments

  • dow.gif
    dow.gif
    10.5 KB · Views: 230
Hi All

An Update on the Dow Fut.

S
 

Attachments

  • Dow Fut 24 May 05 8.45pm.PNG
    Dow Fut 24 May 05 8.45pm.PNG
    67.5 KB · Views: 224
Ref my post 49
VIX closed down at 12.69 for 7 succesive lower closes.
10 DMA is 14.25, therefore 90% is 12.825., which means the market is still stretched too far. But the second VIX signal has still not been given, namely closing lower but above its opening.
Remember the VIX is a relative indicator mesuring implied volatility. We cannot trade it just because it is a low number.
regards, G McA
 
A tight range of 40/50 points and a tough day! Maybe winding up for a big move?

10475 proved to be rock solid support today (480 on futs).

That divergence at the open didn't lead anywhere much and the triangle break after the FOMC minutes should have had a target of 10460 by my reckoning but was stopped by the 10475 support.

The opening gap was filled eventually with the late rally to 10520 but looking well overbought on CCI and down we went again.
 

Attachments

  • chart.gif
    chart.gif
    18.9 KB · Views: 210
The ten minute charts are showing what could be a double top on the Nasdaq and if we drop on the Dow tomorrow then it will be a divergent "bump" top.

If 10475 breaks tomorrow I think I'll be jumping in short.
 

Attachments

  • chart.gif
    chart.gif
    13.6 KB · Views: 183
  • chart2.gif
    chart2.gif
    17.6 KB · Views: 178
My analysis on a short to medium term basis indicates a final push upto at least 10665 on the June contract quite soon ,which should put in a relative high turning point, followed by an ALMIGHTY crash . ( Of course , now that I've written about it , it 'll not pan out . ) But certainly expect to see ALL the major indices fall dramatically to the extent that we'll see (at least ) this quarters lows again .
 
jojo said:
My analysis on a short to medium term basis indicates a final push upto at least 10665 on the June contract quite soon ,which should put in a relative high turning point, followed by an ALMIGHTY crash . ( Of course , now that I've written about it , it 'll not pan out . ) But certainly expect to see ALL the major indices fall dramatically to the extent that we'll see (at least ) this quarters lows again .

Hi, jojo
Hmmn, well not contradicting your view, and acknowledging that you said "at least", but a drop to the quarters lows would not be a "dramatic crash" in my book, if you look back just as far as April you will see that from around this level we moved to near the quarters lows in just 3 days, while that was a sharp move, I wouldn't call it a crash, still. Am more interested in your target of 665 and how you arrive at that number.
cheers
 
Hi roguetrader,
I take your point that a move to this quarters lows may not be a crash.......but I still regard the move down from even where we are, to this quarters lows as quite significant . I basically use fixed support /resistance lines for different markets and the Dow projection is based on firstly , a target on June Ftse of 5030 (the target being generated from certain market criteria on FTSE's supp./res. lines),and secondly, if that happened ,10665 on the Dow would be achieved by the approximate FTSE/DOW correlation, but more importantly that ALSO would be the actual next significant supp./res. level on the Dow.
Regards........Hope this makes sense...........
 
hi All

Just another update - If anybody interested.

S
 

Attachments

  • Dow Fut 25 May 0850am.PNG
    Dow Fut 25 May 0850am.PNG
    71.8 KB · Views: 206
jojo said:
Hi roguetrader,
I take your point that a move to this quarters lows may not be a crash.......but I still regard the move down from even where we are, to this quarters lows as quite significant . I basically use fixed support /resistance lines for different markets and the Dow projection is based on firstly , a target on June Ftse of 5030 (the target being generated from certain market criteria on FTSE's supp./res. lines),and secondly, if that happened ,10665 on the Dow would be achieved by the approximate FTSE/DOW correlation, but more importantly that ALSO would be the actual next significant supp./res. level on the Dow.
Regards........Hope this makes sense...........

Thanx for taking the time to respond jojo, I see how you are calculating the upside now.
 
Indicators

Peterpr (or anybody else for that matter).

Although I manily use EOD software, for my intraday charting, I use CMC proprietary software, which inevitably includes out of hours quotes. As you pointed out yesterday, that may give a distorted reading on some indicators. Is there a way to filter out the out of hours (short of subscribing to a real time service)? Thanks
 
Hi sandrab,

Is your system now suggesting a sell? How reliable is it? Wheres the target and if it is a sell signal on what basis is it being given?
 
Hi All

Another Update

S
 

Attachments

  • Dow Fut 25 May1430.PNG
    Dow Fut 25 May1430.PNG
    69.4 KB · Views: 182
Hi All

Another Update

S
 

Attachments

  • Dow Fut 25 May1445.PNG
    Dow Fut 25 May1445.PNG
    71.6 KB · Views: 217
Trading Shed said:
Peterpr (or anybody else for that matter).

Although I manily use EOD software, for my intraday charting, I use CMC proprietary software, which inevitably includes out of hours quotes. As you pointed out yesterday, that may give a distorted reading on some indicators. Is there a way to filter out the out of hours (short of subscribing to a real time service)? Thanks
TS
Most packages I am aware of will allow you to filter data through user definable time templates that exclude bars between defined hours. It's then a question of obtaining the data series for the package.

Such filtering is a crucial part of effective use of almost any indicator being used for intra-day analysis spanning more than 24 hours and important where any of the data refenced by the indicator is earlier than the current day's open. Not that you MUST exclude out of hours data on 24 hour traded instruments. But you absolutely MUST be aware of the effect of not doing.

For example, if you are using a standard 12,26,9 MACD on an hourly chart the bulk of the referenced data will ALWAYS be BEFORE the current day's open. Do you want that data to be the flat-lining/drifting miniscule volume variety, or from previous day's trading hours? Out-of-hours filtered data will produce very different results to non-filtered. The differences are less marked on FOREX since there is a cycle of trading progressing from the Far East - Europe - US with respectable volumes for each overlapping period, but for the likes of the YM or ES contracts where the vast majority of volume is traded during the 6-7 hour US markets, the distorting effect of the non-filtered data is enormous. Of course, filtering the out of hours data introduces the distorting effect of gaps, but that's another story.

My own view is that I like to use indicators with settings close to what I believe the majority of market participants use. I place less faith in the indicator itself and rather more in the predictability of the actions of those who do. If several thousand traders react to a particular signal at a particular time, they will move the market. My trading day is spent trying to second guess such moves. In other words, IMHO, the psychology behind the use of almost all the trading indicators is more important than any predictive quality in the indicators themselves. The old chickens and eggs conundrum really.
 
superstar said:
How do you judge that the indices are overcooked? they have been downtrending for months and are only just starting to show signs that that trend is broken and an uptrend has resumed. The recent rally is hardly of any major significance and pales in comparison the the recent declines. Either way, price action dictates what is overcooked and what is not and the price action says the rally may just be finding its legs.

I base my trading on 3-5 day time frames. There are down moves in an uptrend and vice versa. Look at price action around 3 day pivots, especially the extremes, they give clues to overbought/oversold conditions. For me the price action did what you outline above, it dictated to me that short term it was overcooked. FTSE & DAX have a bit to go yet on the downside. DOW has finished my short term outlook when it got near 440. The charts say a break of around 430 should lead to a dip anywhere between here and 250. I dont have a fix on it just now but 385ish would be my near term target.

My style of trading is shorter term than others but what I attempt to do is play what I see as smaller gain, high % trades. So overcooked within my time frames may be nothing more than a blip for others.

Apologies if you get two emails, I was replying on a PC which my wife was logged in to. I cut& paste and lost the text but hopefuly I have said the same thing second time around :)
 
The other thing to keep in mind is that from 11K -> 10K we went marginally over the mid point of 50-61.8% fib levels at 10060.8, 10052 is what I have as the mid point. Both these levels are know to be stopping points of a counter move. Just thought it was interesting to point out that small insignficance :LOL:
 
Last edited:
Top