JTrader
Guest
- Messages
- 5,741
- Likes
- 507
you are right, and i've had exactly the same concerns and everyone i ask just avoids this or does not know or says don't backtest, i don't backtest and would not know how, i prefer to test in a simulator.......... i just want to know if i can be profitable in the long run, that's all i want to know with proof of course............im trading it right now and making money, alot the times my winning trades took off on a trend and i got points instead of ticks but your right what you are saying, it's not as straight forward as tro is saying........i love it though and really hope i can continue as it just suits my style, it's simple like me i guess.......... but i know deep down im gonna have to confront the issues you have just raised if im to continue being profitable overall, or do i??
jason
Hi Jason
Well said.
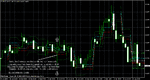
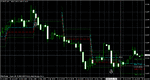
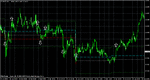
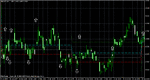
If you look at BZ see on a historical chart with skylines BZ_skyline indicator (see kreslik.com - skylines BZ indicator displays history for previous zones) that some zone periods whip you up & down.
Some candles in such zone periods gave 2 signals on the same candle, one long + one short trade. They both look like a profit will have been made.
However, information can be hidden in the bar - therefore while both trades look like winners, due to hidden tick-by-tick data within say a 15-minute candle, in reality both trades could have been losers, IF the SL was hit after the entry, B4 the profit target was hit. Do you understand this concept?
See attachment.
This makes BZ difficult to backtest anyway, except on the smallest of timeframes.
PS. Although it may be said that BZ is intended for M5 charts, & my example uses M15. If i'd looked hard enough i could have found a candle on M5 charts that displays the same double trade - long + short. I just had this M15 example at hand. Both the long & short appear to be winners, but both could quite easily have hit their SL's before going into profit.